
![]() Event Tracing for Windows (ETW) provides a mechanism to trace and log events that are raised by user-mode applications and kernel-mode drivers. ETW is implemented in the Windows operating system and provides developers a fast, reliable, and versatile set of event tracing features. These logs are also forming a crucial baseline for EDR/XDR solutions to detect suspicious or malicious behavior by integration with the operating system.
Event Tracing for Windows (ETW) provides a mechanism to trace and log events that are raised by user-mode applications and kernel-mode drivers. ETW is implemented in the Windows operating system and provides developers a fast, reliable, and versatile set of event tracing features. These logs are also forming a crucial baseline for EDR/XDR solutions to detect suspicious or malicious behavior by integration with the operating system.
- ETW meets EDR/XDR
- Architecture
- Interacting with ETW
- Extracting ETW Providers
- Further scripts and tools to interact with ETW pragmatically
ETW meets EDR/XDR
Event Tracing for Windows (ETW) plays a pivotal role in enhancing the defense capabilities of Endpoint Detection and Response (EDR) and Extended Detection and Response (XDR) solutions. By seamlessly integrating ETW into these frameworks, organizations gain powerful insights into system activities, enabling proactive threat detection and response mechanisms.
One of the primary advantages of leveraging ETW within EDR/XDR solutions is its ability to capture a wide array of system events with minimal performance impact. ETW allows for the monitoring of various aspects of system behavior, including process creation, network activity, registry modifications, and more. This comprehensive visibility empowers EDR/XDR platforms to detect and investigate suspicious activities in real-time.
For instance, EDR/XDR solutions utilize ETW to detect sophisticated attacks like DCSync attacks, which involve the unauthorized retrieval of Active Directory credentials. By monitoring ETW events related to the replication of domain controller data, EDR/XDR platforms can identify anomalous behavior indicative of a potential DCSync attack. Suspicious activities such as the abuse of privileged credentials or unauthorized modifications to sensitive directory services can trigger alerts, prompting immediate investigation and response from security teams.
Furthermore, the integration of ETW in EDR/XDR solutions enables advanced threat hunting capabilities. Security analysts can leverage ETW logs to perform retrospective analysis, correlating disparate events to uncover hidden threats or indicators of compromise (IOCs). By combining ETW data with threat intelligence feeds and behavioral analytics, organizations can proactively identify and mitigate emerging threats before they escalate into full-blown security incidents.
ETW also facilitates efficient incident response workflows within EDR/XDR environments. In the event of a security incident, forensic investigators can leverage ETW logs to reconstruct the timeline of events, identify the root cause of the compromise, and determine the extent of the impact. This granular visibility into system activities allows for swift remediation actions, minimizing the dwell time of threats and reducing the overall risk posture of the organization.
In summary, the seamless integration of ETW into EDR/XDR solutions empowers organizations to bolster their cyber defense capabilities. By harnessing the rich telemetry provided by ETW, security teams can detect, investigate, and respond to threats with greater speed and precision, ultimately safeguarding critical assets and maintaining the integrity of the enterprise environment.
Some great sources for further readings:
- DamonMohammadbagher/ETWProcessMon2
- Microsoft Documentation on Event Tracing for Windows (ETW)
- A tale on the Windows API system, EDRs and malware evasion
Architecture
The following diagram shows how the ETW architecture looks like:
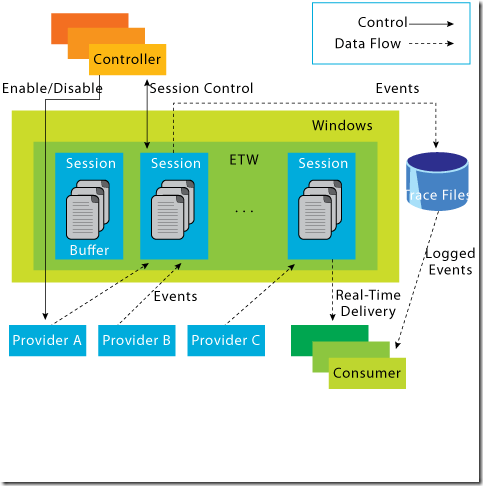
The overarching concept can be summarized as follows: Consider an application, denoted as “Application A,” which executes specific code and necessitates logging of its operations. One approach to accomplish this entails the registration of a “Provider” within ETW. Subsequently, this provider serves as the conduit for disseminating logs to entities interested in accessing them through registration.
To effectively engage with the data provided by this provider, a designated “Consumer” must initiate a “Trace Session.” Through this session, all events dispatched by the provider are captured for analysis. The orchestration of these components, including the commencement and termination of sessions, is overseen by a central “Controller.”
This systematic framework ensures the coherent management and utilization of logging functionalities within the application environment, fostering a robust defensive posture against cyber threats.
Let’s discuss the core components shown in the diagram:
Controllers
True to their designation, the “Controllers” assume the pivotal role of overseeing all facets concerning ETW. This encompasses tasks ranging from the initiation and cessation of trace sessions to the activation and deactivation of providers within a trace. An exemplary instance of such a controller is the pre-existing utility known as “logman.exe,” which will be expounded upon in subsequent discussion and also integrated within some practical scripts.
Providers
Providers assume the role of generating events and depositing them into the designated ETW sessions. Applications possess the capability to register ETW providers and generate events as per their requirements. Notably, ETW accommodates four distinct types of providers:
- MOF Providers
- WPP Providers
- Manifest-based Providers
- TraceLogging Providers
More details about other types can be found here for simplicity I focus on Manifest-based providers from now on.
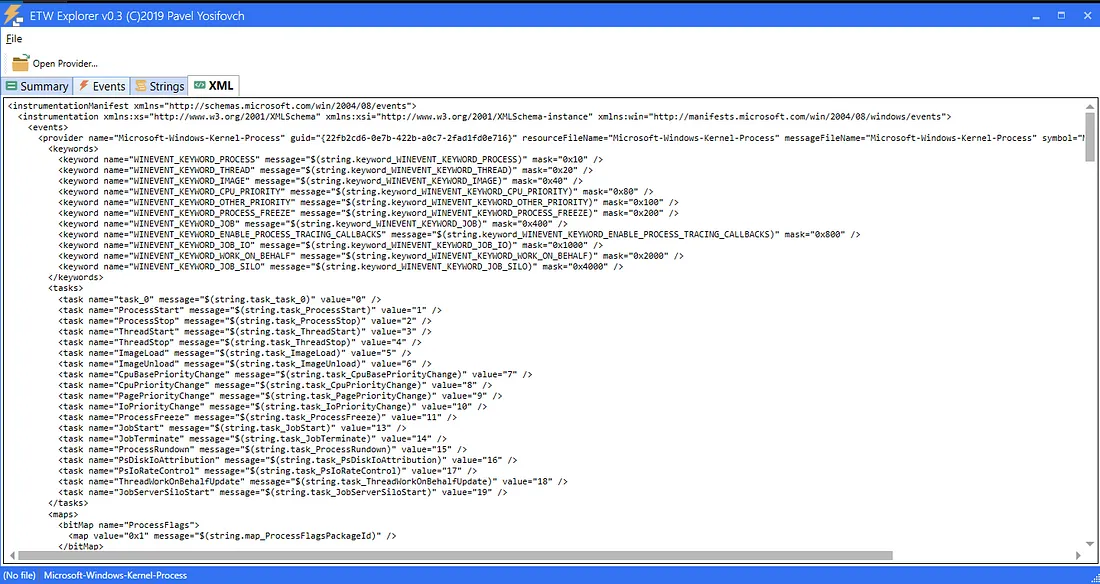
In order for a provider to effectively generate events, it necessitates a blueprint or descriptive framework outlining the structure of these events. In the context of “Manifest-Based providers,” event descriptions are encapsulated within an “Instrumentation Manifest.” This comprehensive document encompasses all pertinent details concerning events, including their structure, filtering mechanisms, values, identifiers, and descriptions. Additional insights regarding this manifest can be found within the resources available on MSDN (Microsoft Developer Network). More details are described here
While parsers exist for these manifests, it is advisable to possess a comprehensive understanding of each field contained within. Primarily, it is imperative to recognize that the “instrumentation manifest” is structured as an XML-based file, indicating that all components within it are XML elements. Consequently, a foundational step involves examining these elements in detail.
provider
The first element is the “
- name — This represents the name of the provider. Its the one that shows when we use a utility like “logman” (That we’ll talk about later)
- guid — This is a globally unique identifier that will identify this provider. Example: {22fb2cd6–0e7b-422b-a0c7–2fad1fd0e716}
- resourceFileName / messageFileName — The path to the executable / DLL that contains the metadata and message resources respectively
- parameterFilePath — The path to the EXE/DLL that contains the strings resources for a provide
What this element actually provide is the identification of the provider and the necessary metadata/strings for tools that want to consume this provider and be able to translate events.
channels
Channels might be already known to you by the windows utility “Event Viewer” which in the end represent channels
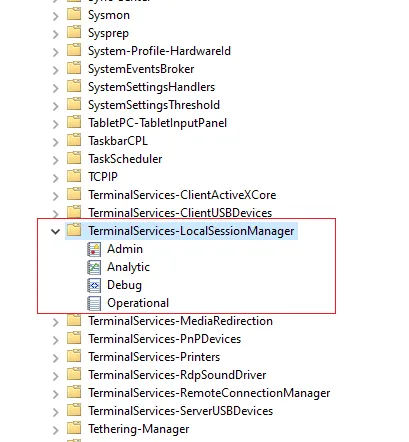
There are four types of channels supported :
- Admin
- Operational
- Analytic
- Debug
-
The manifest lets us describe if we want a provider to write events to specific channels by using the “channel element” and the following attributes:
- chid — A unique identifier that can be used as a reference in other elements.
- name — A name for the channel. The general guidance is to use the name of the provider followed by an “/” and the type of the channel. Example: “Microsoft-Windows-Windows Defender/Operational”
- type — Identify the channel type and can be one of the four values described above.
Here is an example adopted from MSDN:
<channel
    chid="c1"
    name="Microsoft-Windows-Windows Defender/Operational"
    symbol="CHANNEL_DEFENDER_OPERATIONAL"
    type="Operational"
/>
levels
The level element is used to define different log levels and offers the ability to group events based on these levels. The most commonly used levels according to MSDN are the following:
- win:Critical (1)
- win:Error (2)
- win:Warning (3)
- win:Informational (4)
- win:Verbose (5)
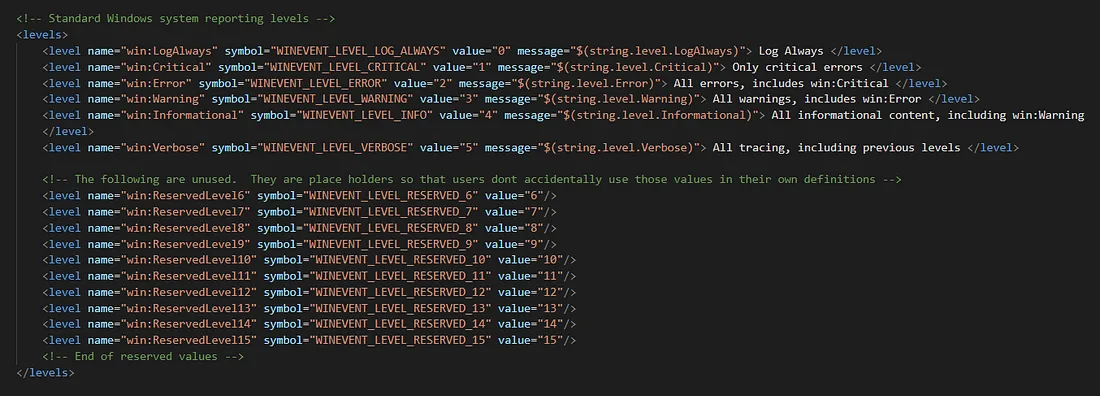
As depicted in the image above, aside from the predefined levels, there are additional reserved levels ranging from 6 to 15. Providers also possess the capability to define custom levels according to their specific requirements. For instance, the Powershell provider has designated level 20 for debug purposes, as illustrated below:
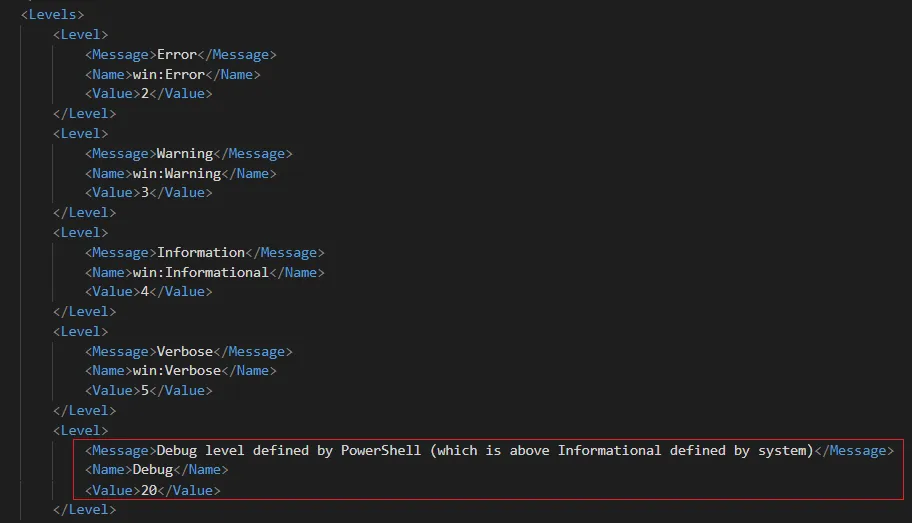
These levels can be used by consumers as a filtering mechanism to get events with specific levels.
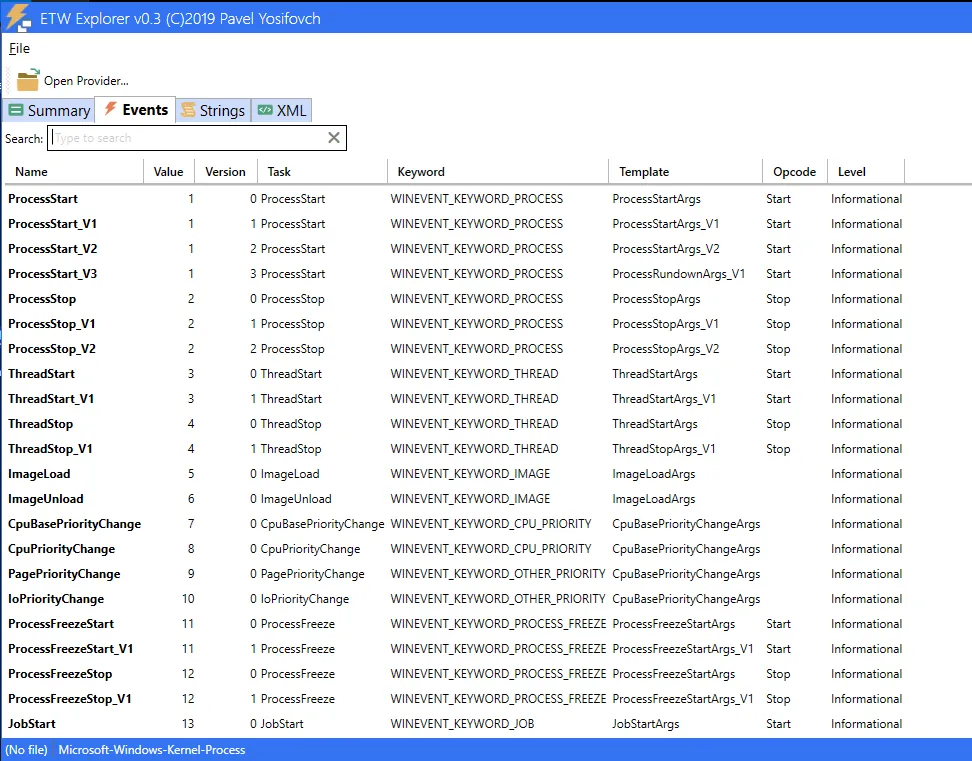
tasks & opcodes
These two elements are used as their name suggests to group events based on tasks and operations. For example, let’s take the “Microsoft-Windows-Kernel-Process” provider. It defines the following tasks
...
<task name="ProcessStart" message="ProcessStart" value="1"/>
<task name="ProcessStop" message="ProcessStop" value="2"/>
<task name="ThreadStart" message="ThreadStart" value="3"/>
<task name="ThreadStop" message="ThreadStop" value="4"/>
...
In this example, these are self-explanatory tasks that consumers can use to filter exactly on the type of events they’d like.
Tasks will generally have a name, message, and a value attribute that are self-explanatory.
Similar to tasks, opcodes can be used to describe specific operations. For example, the “Microsoft-Windows-Powershell” provider defines the following opcodes for the task “connect”.
<task name="Connect" message="Connect" value="1">
     <opcodes>
        <opcode name="Open(async)" message="Open(async)" value="10"/>
        <opcode name="tobeusedwhenanobjectisconstructed" message="tobeusedwhenanobjectisconstructed" value="16"/>
        <opcode name="Tobeusedwhenoperationisjustexecutingamethod" message="Tobeusedwhenoperationisjustexecutingamethod" value="20"/>
     </opcodes>
</task>
There are some predefined opcodes in the “winmeta.xml” file (Windows SDK) that providers can use and you’ll find some when dumping providers manifests. The list can be found here
keywords
Similar to levels and task elements that we’ve seen previously. The keyword element is also used as a grouping mechanism for consumers to filter on. The keywords element uses the following attributes:
- message —A string describing the keyword
- name —A unique name for the keyword for example “ProcessStart”
- mask — A bit mask that must have only a single bit set Here is an example from the “Microsoft-Windows-Kernel-Process” provider:
...
<keywords>
   <keyword name="WINEVENT_KEYWORD_PROCESS" message="WINEVENT_KEYWORD_PROCESS" mask="0x10"/>
   <keyword name="WINEVENT_KEYWORD_THREAD" message="WINEVENT_KEYWORD_THREAD" mask="0x20"/>
   <keyword name="WINEVENT_KEYWORD_IMAGE" message="WINEVENT_KEYWORD_IMAGE" mask="0x40"/>
   <keyword name="WINEVENT_KEYWORD_CPU_PRIORITY" message="WINEVENT_KEYWORD_CPU_PRIORITY" mask="0x80"/>
</keywords>
...
maps
Another interesting element that can help consumers and us when reading manifests is the maps element. This element simply defines a relationship between a value and a string. These maps will be used as a translation mechanism when parsing events data. For example, an event could return a field with certain values and when we try to parse these values we find that they are mapped to specific strings as we can see in the “Microsoft-Windows-DNS-Client” provider:
<maps>
<valueMap name="DnsIpTypeMap">
<map value="0x0" message="static"/>
<map value="0x1" message="dynamic"/>
</valueMap>
</maps>
templates
Sometimes when events are generated their messages are self-contained, meaning that no extra data is required to describe the event. But when an event contains specific data we need to define a template describing the fields we’re adding.
Let’s illustrate this with an example. So we have some action that will generate an event and this event will contain some dynamic data that needs to be mapped as such:
Message : Correlating activity id's. %n %t CurrentActivityId: %1 %n %t ParentActivityId: %2
Now once a consumer sees this it needs to replace the values of “%1” and “%2” with the appropriate data. For this a template is defined as such :
<template tid="T_CorrelationEvent">
<data inType="win:GUID" name="currentActivityId" />
<data inType="win:GUID" name="parentActivityId" />
</template>
From this we can conclude that:
- “%1” represents the “currentActivityId”
- “%2” represents the “parentActivityId” Template attributes contain information about the type of the data and if it’s mapped for example to a “maps” element.
event
Similar to when writing a program one has to declare variables, define functions and classes. All of the elements seen above can be thought of as such. Now that we’ve defined how things are organized its time to define the events themselves.
For every event, a program that wants to write/capture an “
Let’s take an example from the “Microsoft-Windows-Kernel-Process” provider:
<event value="1" symbol="ProcessStart" version="0" task="ProcessStart" opcode="win:Start" level="win:Informational" keywords=
"WINEVENT_KEYWORD_PROCESS" template="ProcessStartArgs"/>
As observed, this snippet includes the essential attribute “value,” configured with a setting of “1.” Consequently, to capture this particular event, one could conduct a search for instances with the value “Event Id=1.” Additionally, numerous other attributes are present, which ideally should be familiar to us by now. These attributes, such as “task,” “opcode,” “level,” and “template,” among others, correspond to previously defined elements. They serve as integral components of the filtering mechanism tailored to cater to the needs of consumers.
localization
The last aspect we’ll discuss is “localization,” a concept that is relatively straightforward. While I have personally handled the substitution in the aforementioned examples, in practice, any of the aforementioned elements will typically feature a definition similar to this one.
<task name="ProcessStart" message="$(string.task_ProcessStart)" value="1"/>
In this scenario, the variable “message” holds a reference to a specific entity, which corresponds to the strings encapsulated within the “localization” element. Allow me to illustrate this with an example:
<localization>
<resources culture="en-GB">
<stringTable>
<string id="keyword_WINEVENT_KEYWORD_PROCESS" value="WINEVENT_KEYWORD_PROCESS"/>
<string id="keyword_WINEVENT_KEYWORD_THREAD" value="WINEVENT_KEYWORD_THREAD"/>
<string id="keyword_WINEVENT_KEYWORD_IMAGE" value="WINEVENT_KEYWORD_IMAGE"/>
...
</stringTable>
</resources>
</localization>
It’s a straightforward concept to understand.
To get a better understanding of this I suggest you walk through an example using a provider manifest.
Trace Sessions / Trace Files (.etl)
Trace sessions function as a mechanism facilitating the subscription to a defined set of providers, accompanied by various configurations. These configurations encompass options such as determining whether the sessions operate in real-time or involve writing to trace files (.etl), among others.
Trace sessions have the ability to enable providers using two types of keyword bitmasks that we’ll see often:
- Keyword (Any): enables you to specify an 8-byte, hexadecimal bitmask value that represents one or more Keywords — MSDN
- Keyword (All): an optional 8-byte, hexadecimal bitmask that further restricts the category of events that an ETW event provider writes — MSDN Let’s illustrate these two concepts with an example adapted from MSDN.
Let’s consider the following three-bit keywords:
- READ: 001
- LOCAL Events: 010
- REMOTE Events: 100
Now, suppose we have two events:
- Event 1 -> Utilizes “READ + LOCAL” keywords (011)
- Event 2 -> Utilizes “READ + REMOTE” keywords (101)
The “Keyword (Any)” parameter enables us to specify the bits we wish to filter on. If any of the event bitmasks match our filter, a hit is obtained.
For instance, to retrieve events related to reading, we could set “Keywords (Any)” to “001” and receive any events with this bit set in their value. For more specificity, setting “Keywords (All)” to “101” would exclusively capture Event 2, while setting it to “011” would solely capture Event 1.
Essentially, the “Any” filter allows us to match with events possessing at least matching bits, whereas the “All” filter mandates that all bits match to capture the event. This distinction proves valuable when querying trace sessions to comprehend their configuration and determine the events captured versus those excluded.
Consumers
The final component within the ETW architecture to be discussed is consumers. These are applications or programs designed to read or listen to Trace Files or Sessions. One notable consumer is the Event Viewer.
Interacting with ETW
Next to Powershell commands the easiest way is using the built-in tool “logman.exe” that acts in the roll of a controller.
We have discussed providers and trace sessions above. It’s important to note that Windows comes pre-installed with over 1000 registered providers and at least a dozen trace sessions. We can retrieve a comprehensive list of these using the logman utility.
Use logman.exe to query providers
Requires NO Administrator privileges
As oneliner:
logman.exe query providers
A more mature script for running into .ps1:
$result = . "c:\Windows\System32\logman.exe" query providers
$list = New-Object "System.Collections.Generic.List[string]";
$list.Add("|Provider | GUID |")
$list.Add("|---- | ---- |")
$result `
| where {$_} `
| select -Skip 2 `
| %{
    $data = $_ -split "{";
    $list.Add("|" + $data[0].TrimEnd() + "|" + "{" + $data[1] + "|");
}
$list.RemoveAt($list.Count -1)
$list
This looks like this example if you run the oneliner
# logman.exe query providers
[Provider]               [GUID]
--------------------------------------------------------------------
...
Microsoft-Windows-Crypto-CNG  {E3E0E2F0-C9C5-11E0-8AB9-9EBC4824019B}
Microsoft-Windows-Crypto-RNG  {54D5AC20-E14F-4FDA-92DA-EBF7556FF176}
Microsoft-Windows-D3D9        {783ACA0A-790E-4D7F-8451-AA850511C6B9}
Microsoft-Windows-Data-Pdf    {B97561FE-B27A-4C48-AA3E-7D3ADDC105B1}
Microsoft-Windows-DCLocator   {CFAA5446-C6C4-4F5C-866F-31C9B55B962D}
Microsoft-Windows-DDisplay    {75051C9D-2833-4A29-8923-046DB7A432CA}
...
Use logman.exe to query information about a specific provider
Requires NO Administrator privileges
As oneliner:
logman.exe query providers "<ADD PROVIDER NAME HERE>"
Example output:
# logman.exe query providers "Microsoft-Windows-WMI-Activity"
Provider                                 GUID
--------------------------------------------------------------------
Microsoft-Windows-WMI-Activity           {1418EF04-B0B4-4623-BF7E-D74AB47BBDAA}
Value               Keyword              Description
--------------------------------------------------------------------
0x8000000000000000  Microsoft-Windows-WMI-Activity/Trace
0x4000000000000000  Microsoft-Windows-WMI-Activity/Operational
0x2000000000000000  Microsoft-Windows-WMI-Activity/Debug
Value               Level                Description
--------------------------------------------------------------------
0x02                win:Error            Error
0x04                win:Informational    Information
PID                 Image
--------------------------------------------------------------------
0x000012d4          C:\Windows\System32\wbem\WmiPrvSE.exe
0x00000dd4          C:\Windows\System32\svchost.exe
0x00000dd4          C:\Windows\System32\svchost.exe
0x00000cb4          C:\Windows\System32\wbem\WmiPrvSE.exe
0x00000a30          C:\Windows\System32\svchost.exe
Use logman.exe to query active trace sessions
Requires NO Administrator privileges
As oneliner:
logman.exe query "EventLog-System" -ets
Example output:
Name:                 EventLog-System
Status:               Running
Root Path:            %systemdrive%\PerfLogs\Admin
Segment:              Off
Schedules:            On
Segment Max Size:     100 MB
Name:                 EventLog-System\EventLog-System
Type:                 Trace
Append:               Off
Circular:             Off
Overwrite:            Off
Buffer Size:          64
Buffers Lost:         0
Buffers Written:      1345
Buffer Flush Timer:   1
Clock Type:           System
File Mode:            Real-time
Provider:
Name:                 Microsoft-Windows-FunctionDiscoveryHost
Provider Guid:        {538CBBAD-4877-4EB2-B26E-7CAEE8F0F8CB}
Level:                255
KeywordsAll:          0x0
KeywordsAny:          0x8000000000000000 (System)
Properties:           65
Filter Type:          0
Provider:
Name:                 Microsoft-Windows-Subsys-SMSS
Provider Guid:        {43E63DA5-41D1-4FBF-ADED-1BBED98FDD1D}
Level:                255
KeywordsAll:          0x0
KeywordsAny:          0x4000000000000000 (System)
Properties:           65
Filter Type:          0
Provider:
Name:                 Microsoft-Windows-Kernel-General
Provider Guid:        {A68CA8B7-004F-D7B6-A698-07E2DE0F1F5D}
Level:                255
KeywordsAll:          0x0
KeywordsAny:          0x8000000000000000 (System)
Properties:           65
Filter Type:          0
...
Using Powershell - Get ETW Trace Provider
Requires Administrator privileges
As oneliner:
Get-NetEventProvider -ShowInstalled | Select-Object Name,Guid | sort Name
Move into a .ps1 file for better output:
#Requires -RunAsAdministrator
$result = Get-EtwTraceProvider | sort SessionName
$result | %{"|Name|GUID|";"|----|----|";}{"|$($_.SessionName)|$($_.Guid)|"}
Using Powershell - Get NetEvent Provider
Requires Administrator privileges
As oneliner:
Get-NetEventProvider -ShowInstalled | Select-Object Name,Guid | sort Name
Move into a .ps1 file for better output:
$result = Get-NetEventProvider -ShowInstalled | sort Name
$result | %{"|Name|GUID|";"|----|----|";}{"|$($_.Name)|$($_.Guid)|"}
Extracting ETW Providers
We have explored various examples demonstrating interaction with ETW. However, there are instances when we simply require the provider manifest in a tangible form, as a single file, rather than accessing properties of the object. Fortunately, there are several methods available for extracting these manifests, including tools like ETW Explorer and PerfView.
ETW Explorer / Perfview
“ETW Explorer” and “Perfview” actually use the same API under the hood to extract the provider manifest.
RegisteredTraceEventParser.GetManifestForRegisteredProvider
ETW Explorer can be downloaded and used directly from here. The tool itself is kind of self-explanatory. Some ideas and impressions are shown below:
Summary about the Kernel-Process:

Quick insights into event:
Overview about a manifest:
Further scripts and tools to interact with ETW pragmatically
- KrabsETW
- SilkETW
- PyWintrace
- Powershell(.NET)
- WinAPI (Tdh.dll, Wevtapi.dll)