
Transportable Detonation Chamber - Malware Detonation Lab in a Box
![]() The Transportable Detonation Chamber (TDC) is a pre-configured Windows 11 VM for malware detonation testing against multiple EDR solutions. It ships with a unified dark-themed Web UI, real-time Sigma/YARA/IOC detection, kernel ETW telemetry, and supports both Windows (Hyper-V) and macOS Apple Silicon (QEMU/UTM). The goal: spin up an isolated analysis environment in minutes, detonate samples, and observe detection coverage across multiple engines simultaneously.
The Transportable Detonation Chamber (TDC) is a pre-configured Windows 11 VM for malware detonation testing against multiple EDR solutions. It ships with a unified dark-themed Web UI, real-time Sigma/YARA/IOC detection, kernel ETW telemetry, and supports both Windows (Hyper-V) and macOS Apple Silicon (QEMU/UTM). The goal: spin up an isolated analysis environment in minutes, detonate samples, and observe detection coverage across multiple engines simultaneously.
The Problem
Testing malware samples against EDR solutions typically requires maintaining multiple VMs, manually installing and configuring detection tools, and correlating outputs across disparate interfaces. This is time-consuming, error-prone, and makes it hard to get a holistic view of detection coverage for a given sample. You end up context-switching between Sysmon logs, YARA scanners, ETW traces, and sandbox results without a unified picture.
The Solution
TDC packages everything into a single Vagrant-provisioned VM with a unified web interface on port 9000. Submit a sample, and watch as multiple detection engines analyze it in parallel while a single dashboard aggregates all findings. One command to spin up, one interface to view everything.
Architecture
The system runs multiple core services inside the VM, each handling a different layer of analysis:
Data flow:
- Sample submitted via Web UI is forwarded to DetonatorAgent + LitterBox
- DetonatorAgent executes the sample and returns the PID
- LitterBox runs static (YARA, CheckPlz, Stringnalyzer) + dynamic (PE-Sieve, Moneta, HollowsHunter, RedEdr) analysis
- Fibratus captures kernel-level ETW events for the process
- Rustinel matches events against Sigma + YARA rules + IOC hashes
- Web UI aggregates alerts from all engines into a unified timeline
| Service | Port | Purpose | Technology |
|---|---|---|---|
| Web UI | 9000 | Unified dashboard & API gateway | Python / Flask |
| DetonatorAgent | 8080 | Executes malware samples, returns PID | .NET 8.0 |
| LitterBox | 1337 | Static + dynamic analysis sandbox | Python / Flask |
| Fibratus | 8180 | Kernel ETW telemetry & behavior rules | Go |
| Rustinel | — | Sigma/YARA/IOC real-time detection | Rust |
| Sysmon | — | Windows event logging | Sysinternals |
| Hunt-Sleeping-Beacons | — | Sleeping C2 beacon callstack scanner | C++ / MSVC |
| theZoo-WebUI | 8888 | Malware sample browser | PHP |
Detection Engines
| Engine | Technology | Capabilities |
|---|---|---|
| Rustinel | Rust + ETW | 20 Sigma rules, 717 YARA rules, IOC hash matching, real-time NDJSON alerts |
| Fibratus | Go + Kernel ETW | Process/file/registry/network telemetry, behavior rules |
| Sysmon | Sysinternals | Event logging (process creation, network, file, registry, image loads) |
| LitterBox | Python | Static (YARA, strings) + Dynamic (PE-Sieve, Moneta, HollowsHunter, RedEdr) |
Detection rule coverage includes 14 process_creation rules (encoded PowerShell, schtasks, LOLBins, credential dumping), 3 registry_event rules (Run key persistence, Defender tampering, WDigest), plus task_creation, ps_script, and service_creation rules.
Web UI
The single-page dark-themed interface aggregates telemetry from all engines across seven tabs:
Dashboard
Stats strip showing alerts by severity, active processes, service health, loaded rules, and available tools. Six service health cards provide at-a-glance status for all detection components, and a recent activity feed shows detection alerts with severity coloring and rule names.
Tracing & Detection
Real-time ETW event console with process filtering, timeline visualization, and click-through to full detail panels including raw JSON, ATT&CK tags, and related processes.
Process Graph
Interactive process relationship visualization with 5 layout modes (Force-directed, Hierarchical, Radial, Circular, Grid), zoom controls, search by name/PID, time-range filtering, and detail panels for each process node.
Scanner
ThreatCheck + DefenderCheck integration identifies the exact bytes triggering Defender/AMSI detection. Results show detection status, byte offset of the trigger, and link directly to the hex editor for inspection.
Hex Editor & Binary Analysis
Full binary file viewer with drag-and-drop upload, data inspector (Int8/16/32/64, Float32/64, ASCII, UTF-16), and deep PE/ELF analysis capabilities.
PE Analysis
Parses full PE structure including DOS/File/Optional headers, section table with entropy bars, security feature detection (ASLR/DEP/SEH/CFG), suspicious import categorization, packer identification, and RWX section flagging.
Submit & Detonation
Multi-target sample detonation with stage-by-stage progress tracking (Upload, Execute, Static, Dynamic, EDR). Supports DetonatorAgent only, LitterBox only, or both targets simultaneously.
Analysis Capabilities
Beyond basic detection, TDC provides deep binary analysis:
- PE Header Analysis — DOS/File/Optional headers, section table with entropy bars, ASLR/DEP/SEH/CFG detection
- ELF Binary Analysis — ELF32/64 header, program headers, section table, dynamic linking, symbol imports/exports
- ELF Security Audit — PIE, NX stack, RELRO (Full/Partial), stack canary, Fortify, stripped detection
- Entropy Visualization — Per-section Shannon entropy with color coding (red >= 7.0 indicates packed/encrypted)
- Packer Identification — UPX, Themida, VMProtect, ASPack, MPRESS via section name matching
- Suspicious Import Detection — Categorized by injection, evasion, credential access, networking, crypto, shellcode
- Hunt-Sleeping-Beacons — Callstack scanner for identifying sleeping C2 beacons (unbacked memory, module stomping, APC/Timer sleepmasks, return address spoofing)
Reverse Engineering Tools
The VM comes pre-installed with:
- Detect It Easy (DiE) — PE/ELF/Mach-O identification (packers, compilers, protectors, linkers)
- WinDbg Preview — Kernel/user-mode debugger with crash dumps, live debugging, and TTD
- Ghidra — NSA reverse engineering framework for disassembly, decompilation, and scripting
Quick Start
# macOS / Linux - Full VM
make up         # Provisions the Windows 11 VM (~20-30 min first boot)
make open       # Opens http://<vm-ip>:9000 in browser

# Windows (PowerShell, run as Administrator)
.\make.ps1 up
.\make.ps1 open

# Local UI development only (no VM needed)
make install    # Creates venv, installs Flask + deps
make run        # Starts on http://localhost:9000
Detonation Workflow
- Open the Web UI at
http://localhost:9000 - Navigate to the Submit tab
- Drag and drop a malware sample
- Select target: Agent (execution), LitterBox (analysis), or Both
- Click Submit and watch the pipeline stages progress
- Switch to Tracing for real-time ETW alerts
- Switch to Graph for process relationship visualization
- Check Dashboard for severity breakdown
CLI submission is also supported:
# macOS / Linux
make submit FILE=./samples/mimikatz.exe TARGET=both

# Windows
.\make.ps1 submit -File .\samples\mimikatz.exe -Target2 both
Developer Experience
TDC is designed to be iterable for detection engineering work:
make deploy-restart— Edit locally, push to VM, restart Flask in one commandmake run-debug— Flask auto-reload on file changes (local dev)- Loading Spinner — Global overlay with 300ms delay threshold
- Help Modal — Built-in documentation (press “? Help” in sidebar)
- Submissions History — Persisted to JSON, with Hex button for quick inspection
Platform Support
| Host OS | Hypervisor | Guest Arch | Performance |
|---|---|---|---|
| Windows 10/11 (x86_64) | Hyper-V | x86_64 | Native |
| macOS Apple Silicon (M1-M4) | QEMU via vagrant-qemu | ARM64 | Near-native via hvf |
ARM64 compatibility: Sysmon runs natively (ARM64 binary), while Fibratus and Rustinel run under x86_64 emulation with ~10-20% overhead. .NET 8, Python 3.12, DetonatorAgent, and LitterBox all run natively on ARM64.
Security Considerations
- Treat the VM as compromised after any detonation
- Use snapshots before each analysis session (
vagrant snapshot save clean_state) - Network isolation is recommended (Hyper-V internal/private switch)
- The Web UI has no authentication — bind to localhost or isolated networks only
- Defender exclusions are configured for detonation paths only
- Rustinel active response is disabled by default
Demo
The following walkthroughs show TDC in action — from initial detonation through detection, analysis, and correlation.
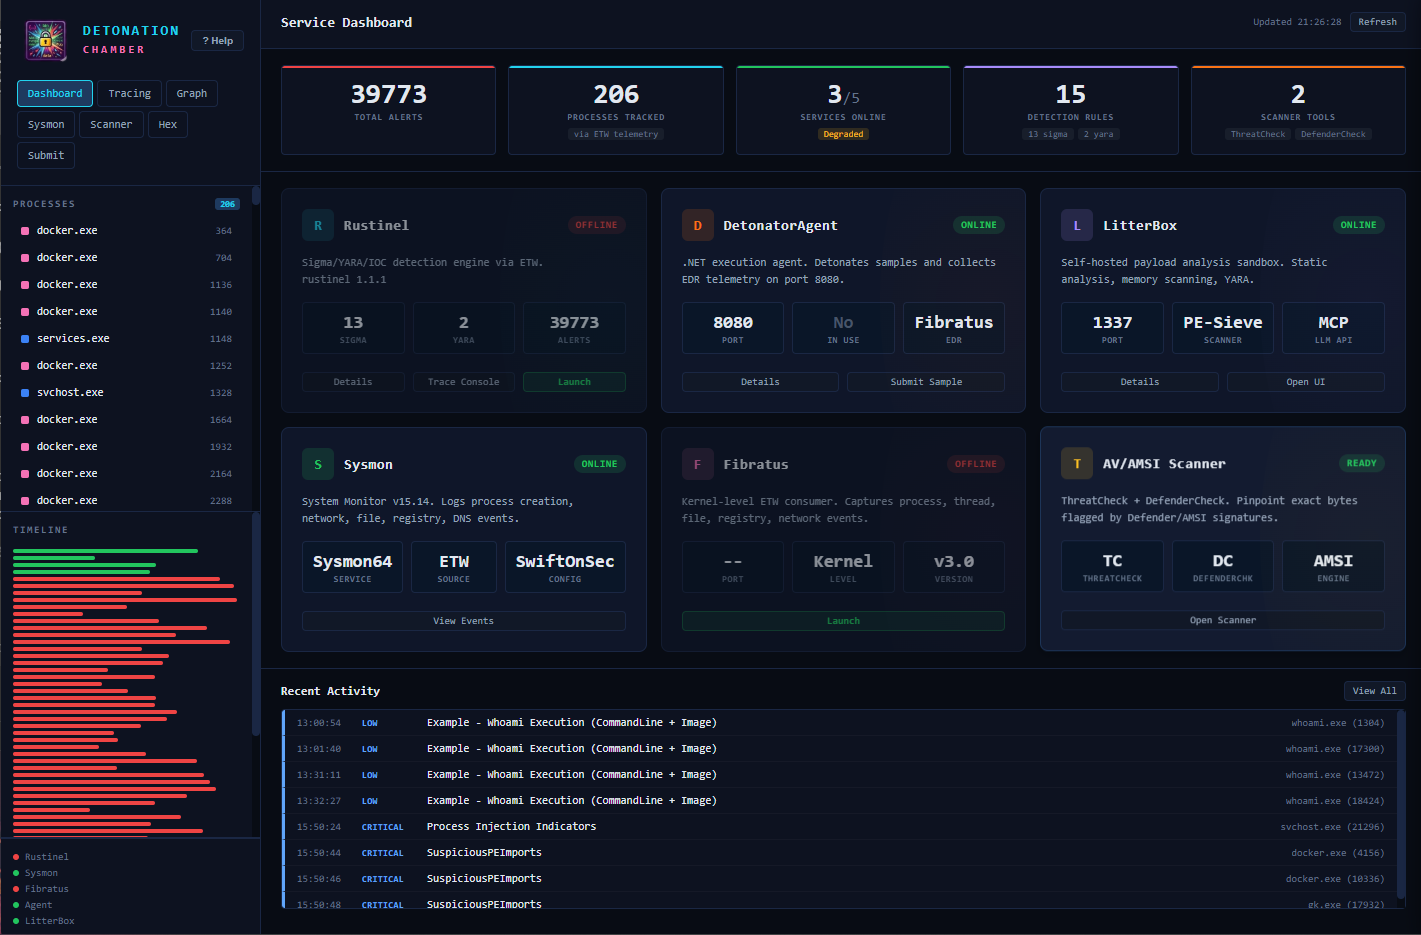
Service Dashboard
The main landing page shows a stats strip with total alerts, tracked processes, service health (online/degraded), loaded detection rules (Sigma + YARA), and available scanner tools. Six service health cards cover Rustinel, DetonatorAgent, LitterBox, Sysmon, Fibratus, and AV/AMSI Scanner — each displaying port, version, and quick-action buttons. The Recent Activity feed streams live detections with severity coloring (LOW for Sigma rules like Whoami Execution, CRITICAL for YARA hits like SuspiciousPEImports). The sidebar lists all tracked processes with alert counts and a color-coded timeline per engine.
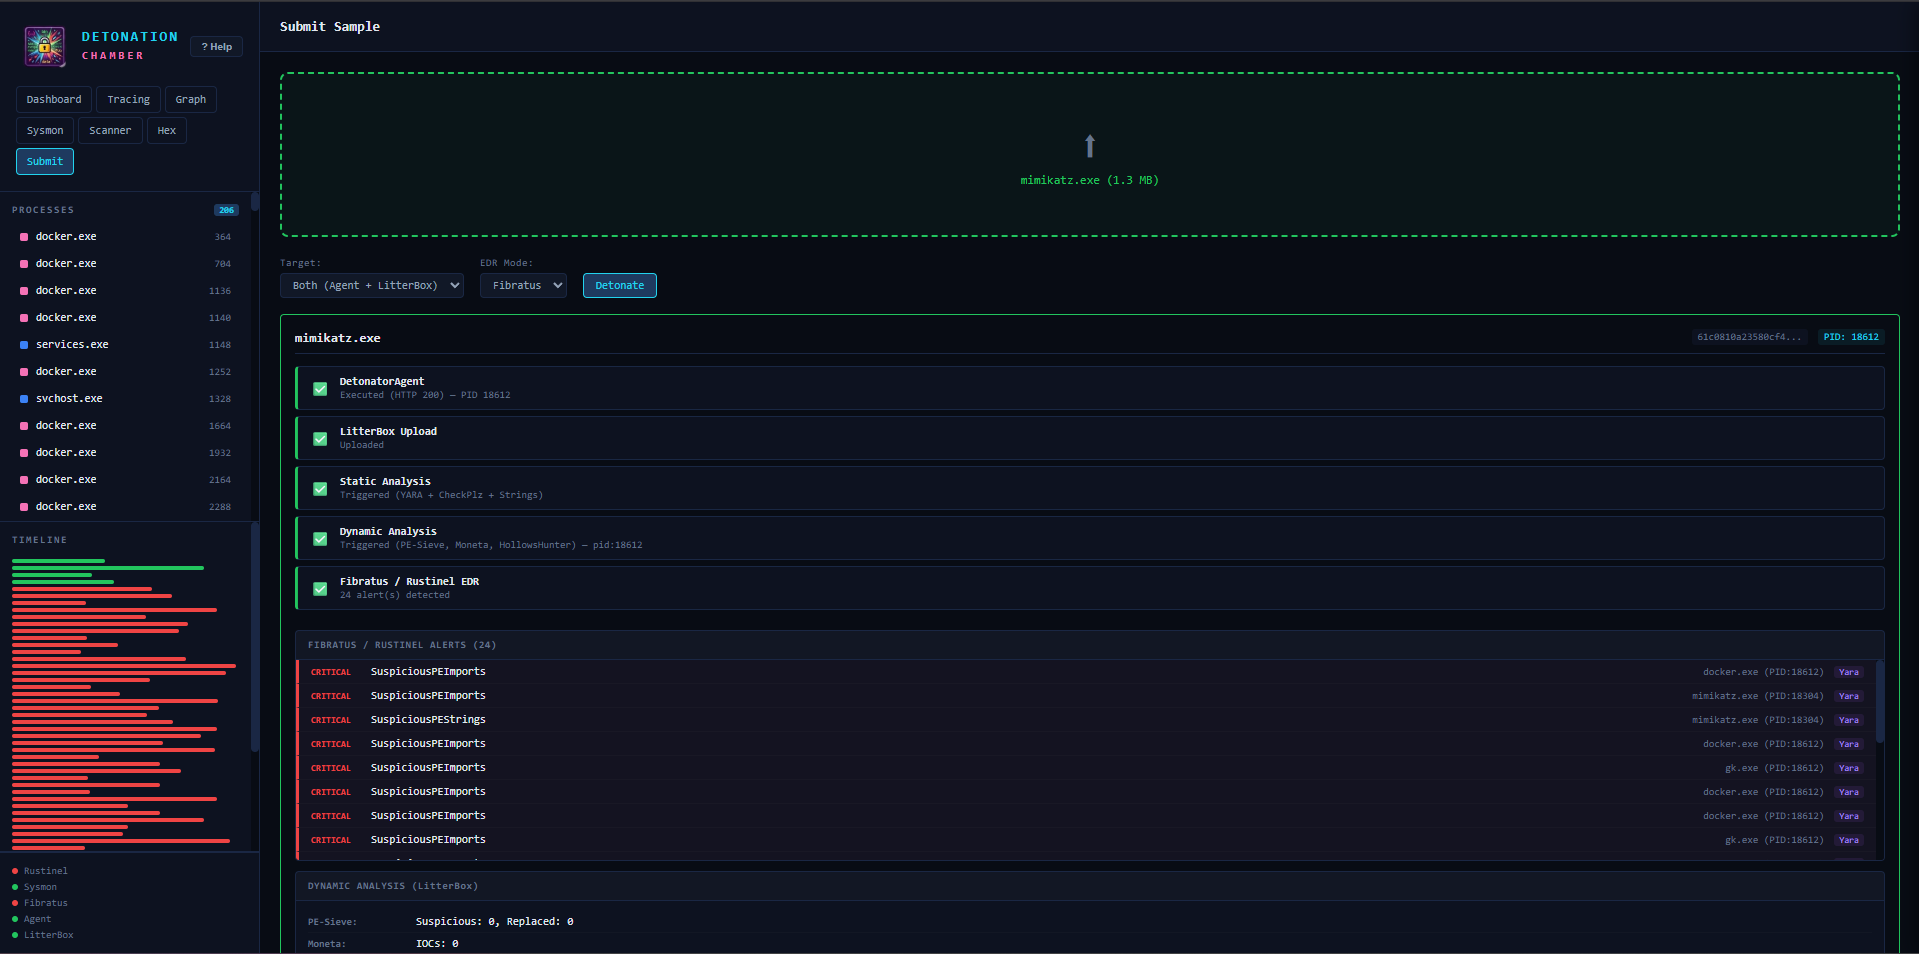
Sample Detonation (Mimikatz)
The Submit tab after detonating mimikatz.exe (1.3 MB) with target “Both (Agent + LitterBox)” and Fibratus EDR mode. The pipeline shows all 5 stages completed: DetonatorAgent execution (HTTP 200, PID 18612), LitterBox upload, Static Analysis (YARA + CheckPlz + Strings), Dynamic Analysis (PE-Sieve, Moneta, HollowsHunter), and Fibratus/Rustinel EDR (24 alerts). Below lists all CRITICAL detections — SuspiciousPEImports on docker.exe, mimikatz.exe, and gk.exe. Dynamic results include PE-Sieve (Suspicious: 0) and Moneta (IOCs: 0).
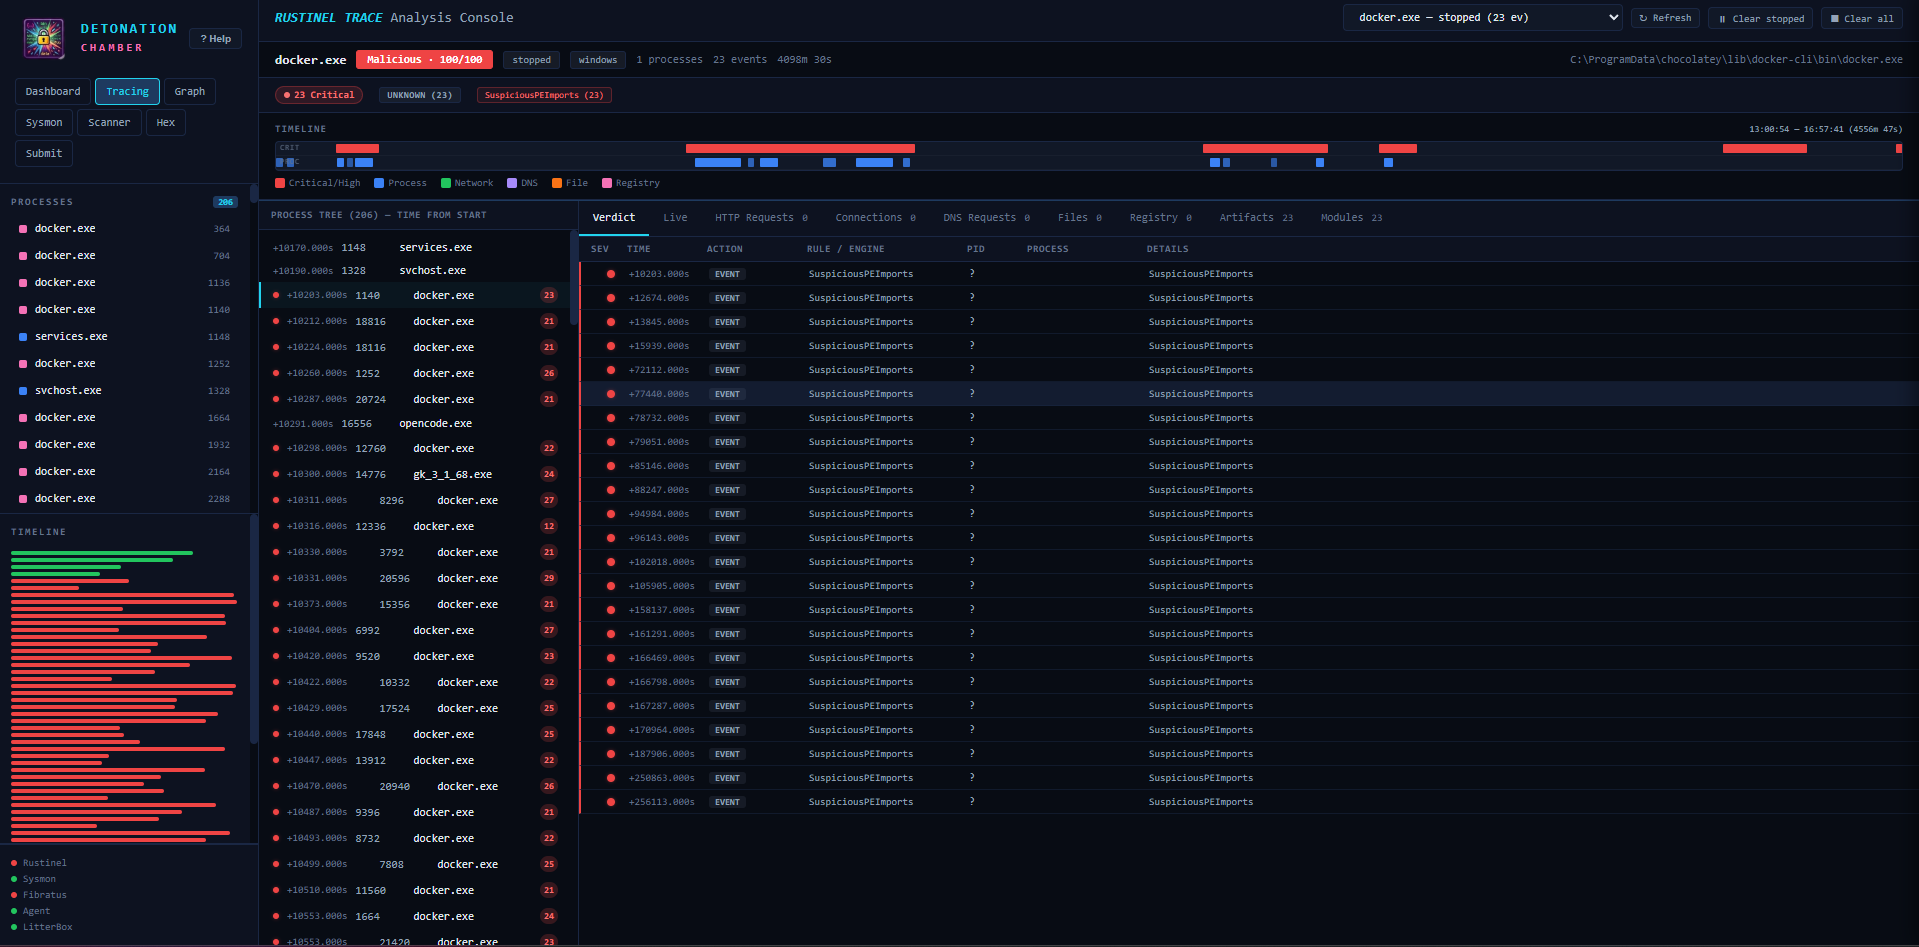
Rustinel Trace Analysis
The Tracing console for a process scored “Malicious 100/100” with 23 events. Filter pills show severity breakdown (“23 Critical”, “SuspiciousPEImports (23)”). A timeline bar visualizes event distribution by type (Critical/High, Process, Network, DNS, File, Registry). The verdict table lists each hit with severity, timestamp offset, rule name, and PID. Tabs allow switching between Live, HTTP Requests, Connections, DNS, Files, Registry, Artifacts, and Modules views.
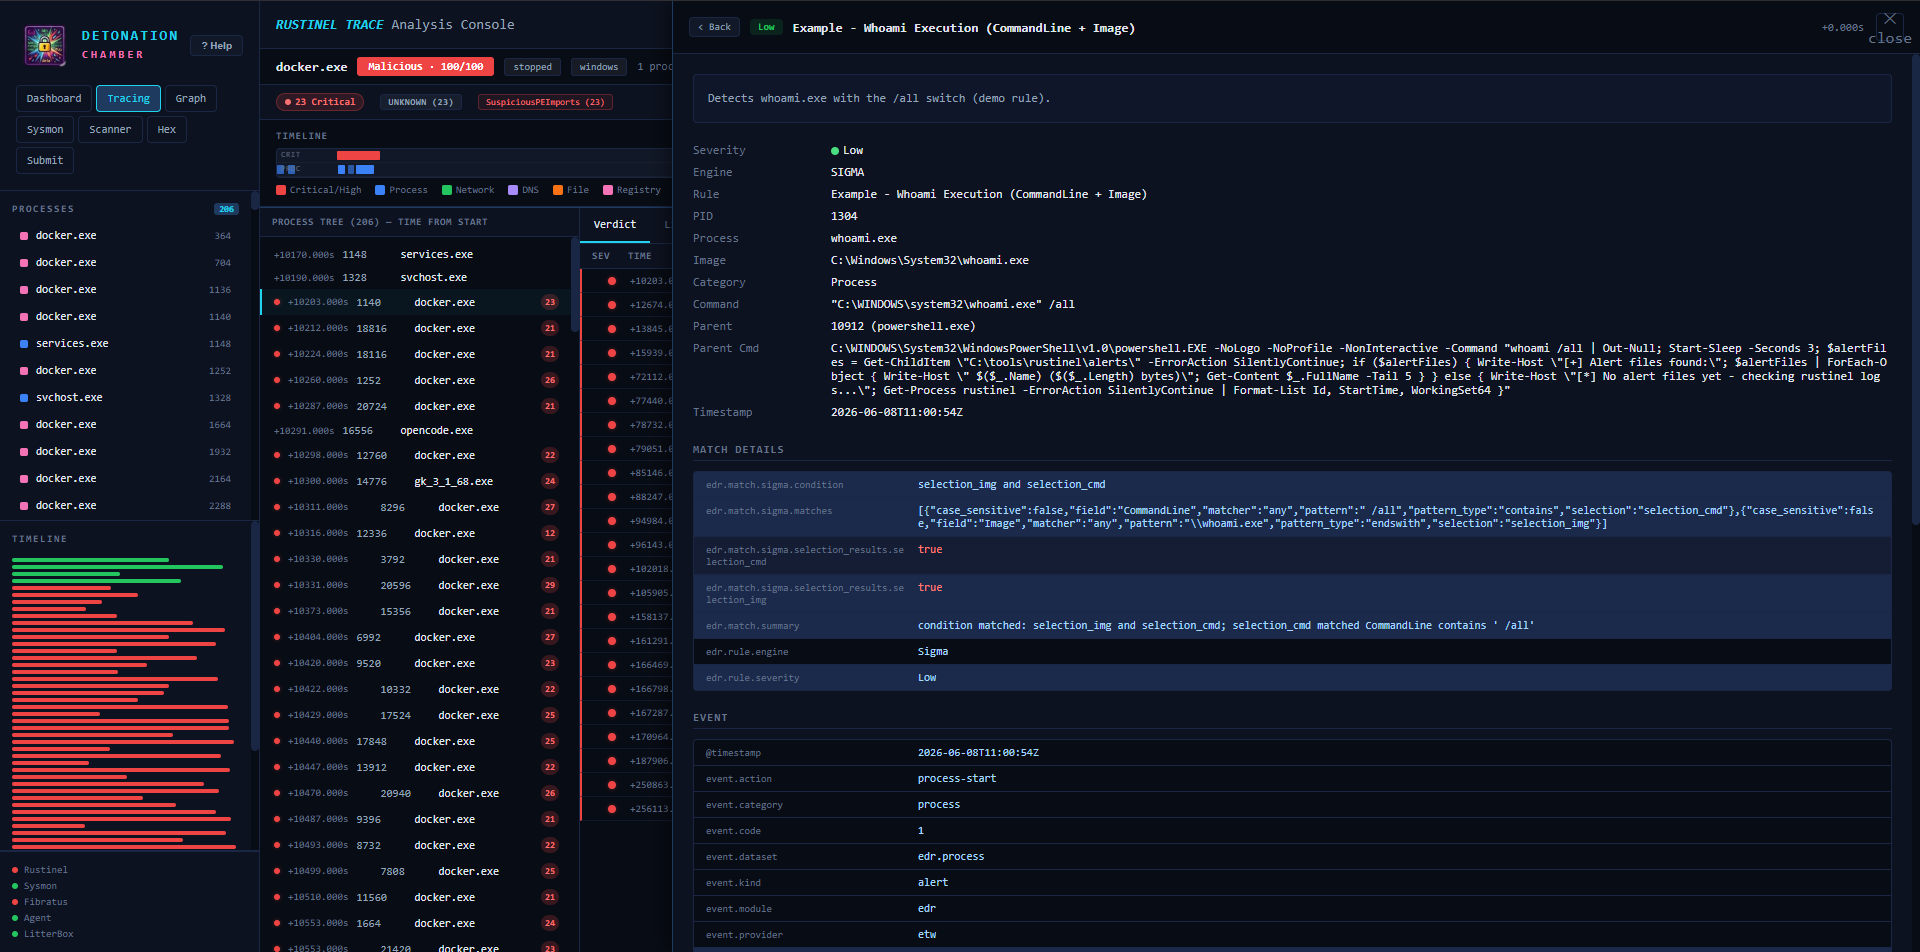
The alert detail panel for a Sigma hit: “Example - Whoami Execution (CommandLine + Image)”. Shows severity (Low), engine (SIGMA), PID (1304), process (whoami.exe), command line, parent info (powershell.exe PID 10912), and full parent command. MATCH DETAILS shows condition logic (selection_img AND selection_cmd) with JSON patterns. The EVENT section contains complete ECS fields (@timestamp, event.action: process-start, event.kind: alert, event.provider: etw).
Process Relationship Graph
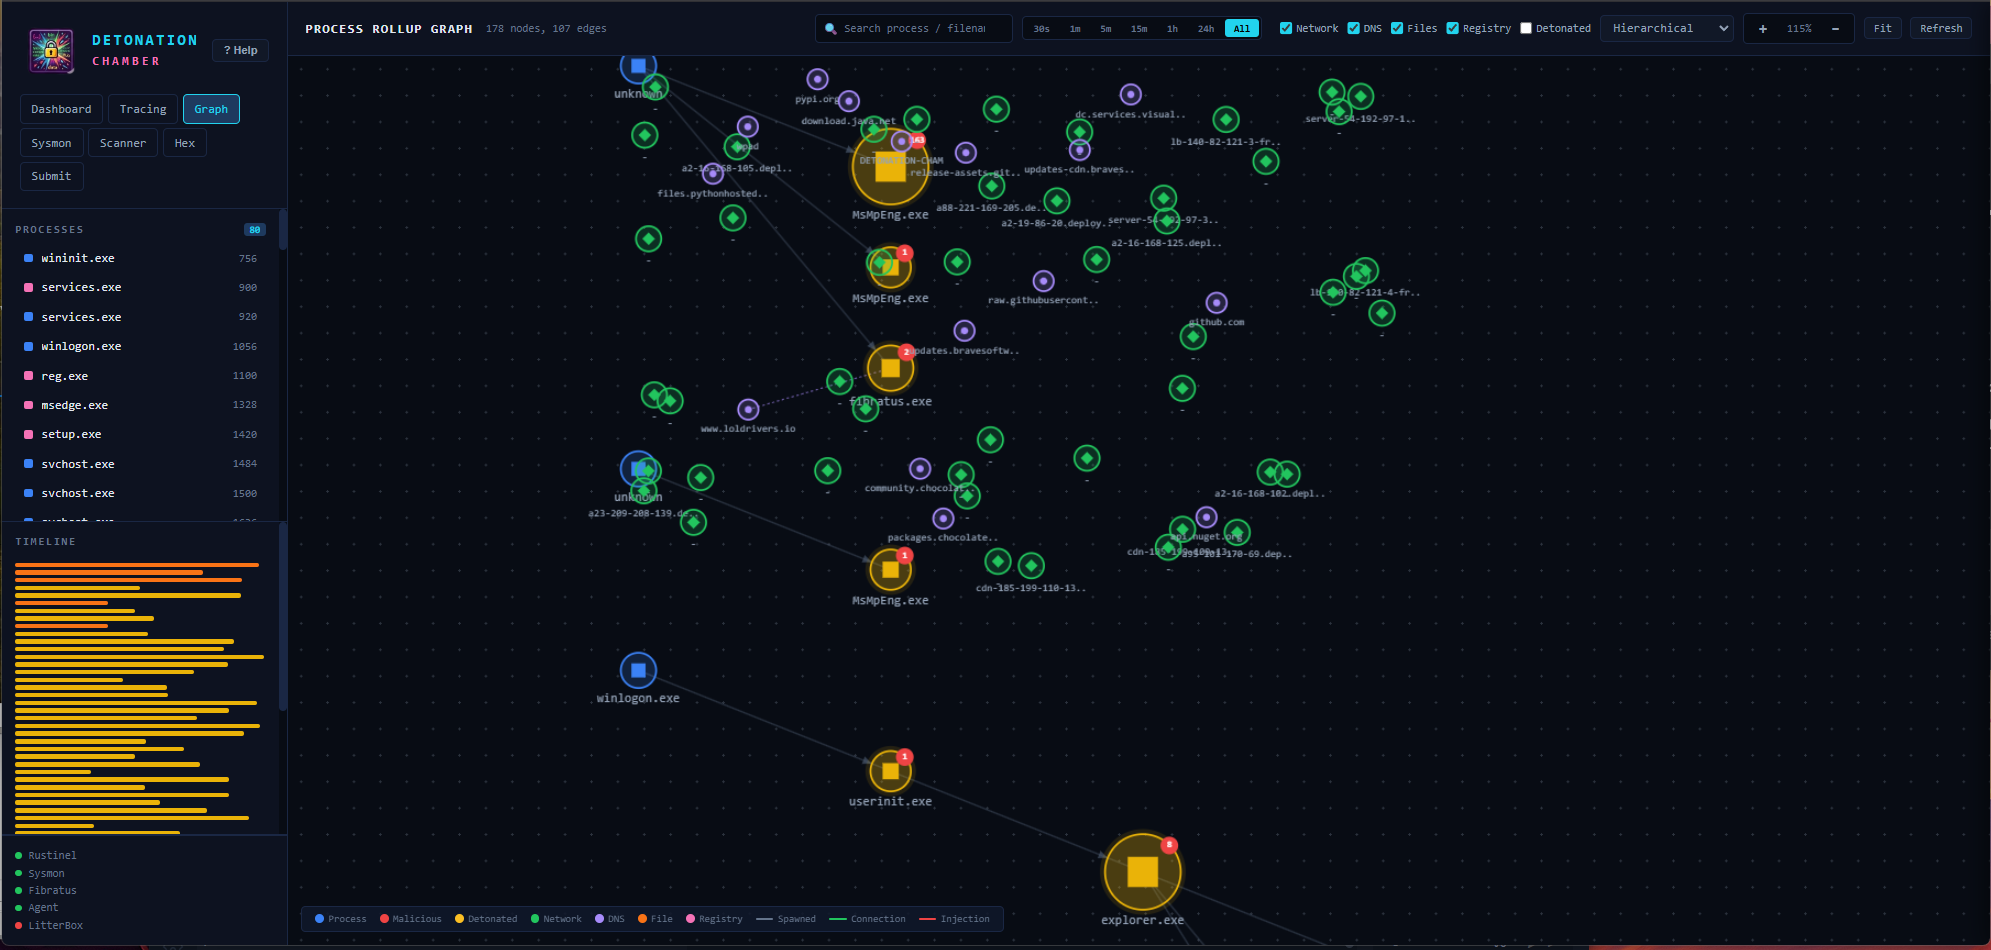
Hierarchical layout showing 178 nodes, 107 edges. Color-coded nodes represent different categories: blue squares (system processes — winlogon.exe, explorer.exe, userinit.exe), yellow/orange with red badges (malicious/detonated — fibratus.exe, MsMpEng.exe), green diamonds (network connections — pypi.org, github.com, loldrivers.io), and purple circles (DNS). Edge types: solid lines for process spawn, dashed for network connections, red for injection. Filters allow toggling Network, DNS, Files, Registry, and Detonated nodes. Time ranges span from 30s to All.
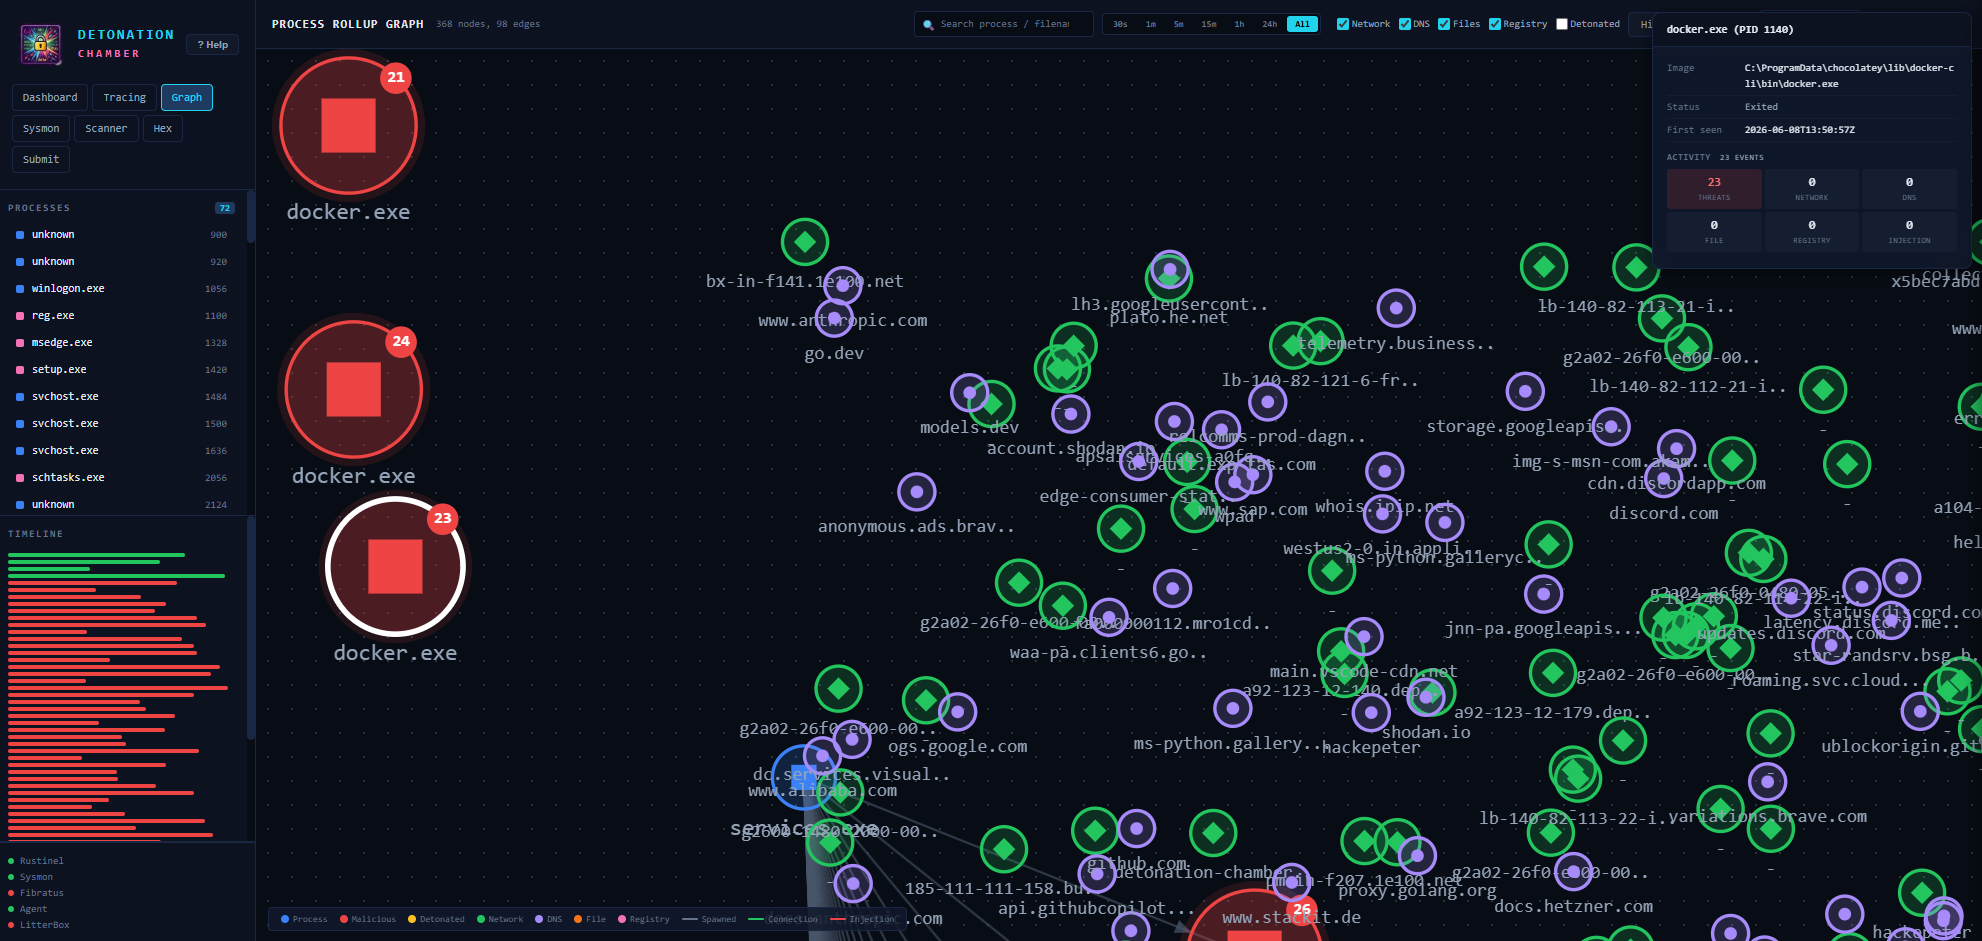
Force-directed layout with a selected process node (e.g. docker.exe PID 1148). The detail panel shows image path, process status (Exited), and activity breakdown (Threats, Network, DNS, File, Registry, Injection). Multiple large red nodes (processes with 21-24 alerts each) are surrounded by a dense network/DNS web connecting to destinations like discord.com, shodan.io, github.com, google.com, storage.googleapis, and more.
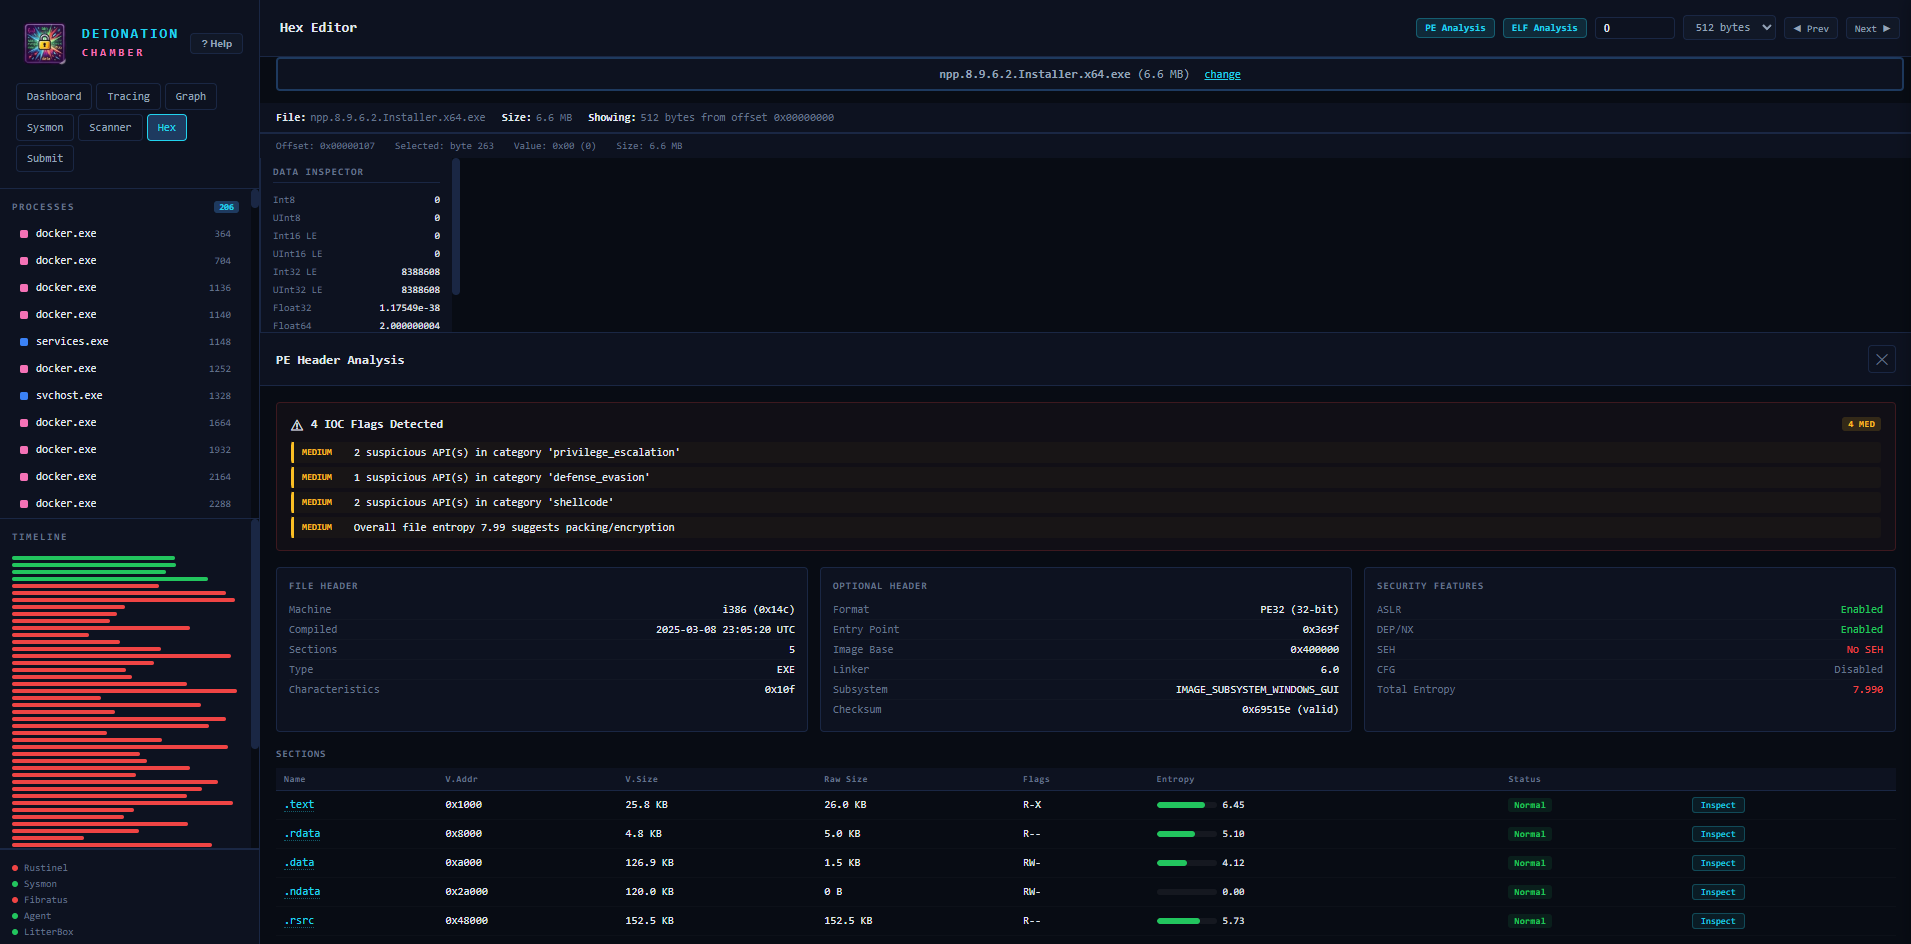
PE Binary Analysis & Packer Detection
PE Header Analysis for a binary showing IOC flags detected — suspicious APIs categorized by privilege_escalation, defense_evasion, and shellcode, plus high entropy indicating packing. Three-column layout: FILE HEADER (architecture, timestamp, section count), OPTIONAL HEADER (PE type, entry point, linker version, subsystem), and SECURITY FEATURES (ASLR/DEP enabled, SEH status, CFG status, overall entropy). Section table with entropy bars and “Inspect” buttons for each section.
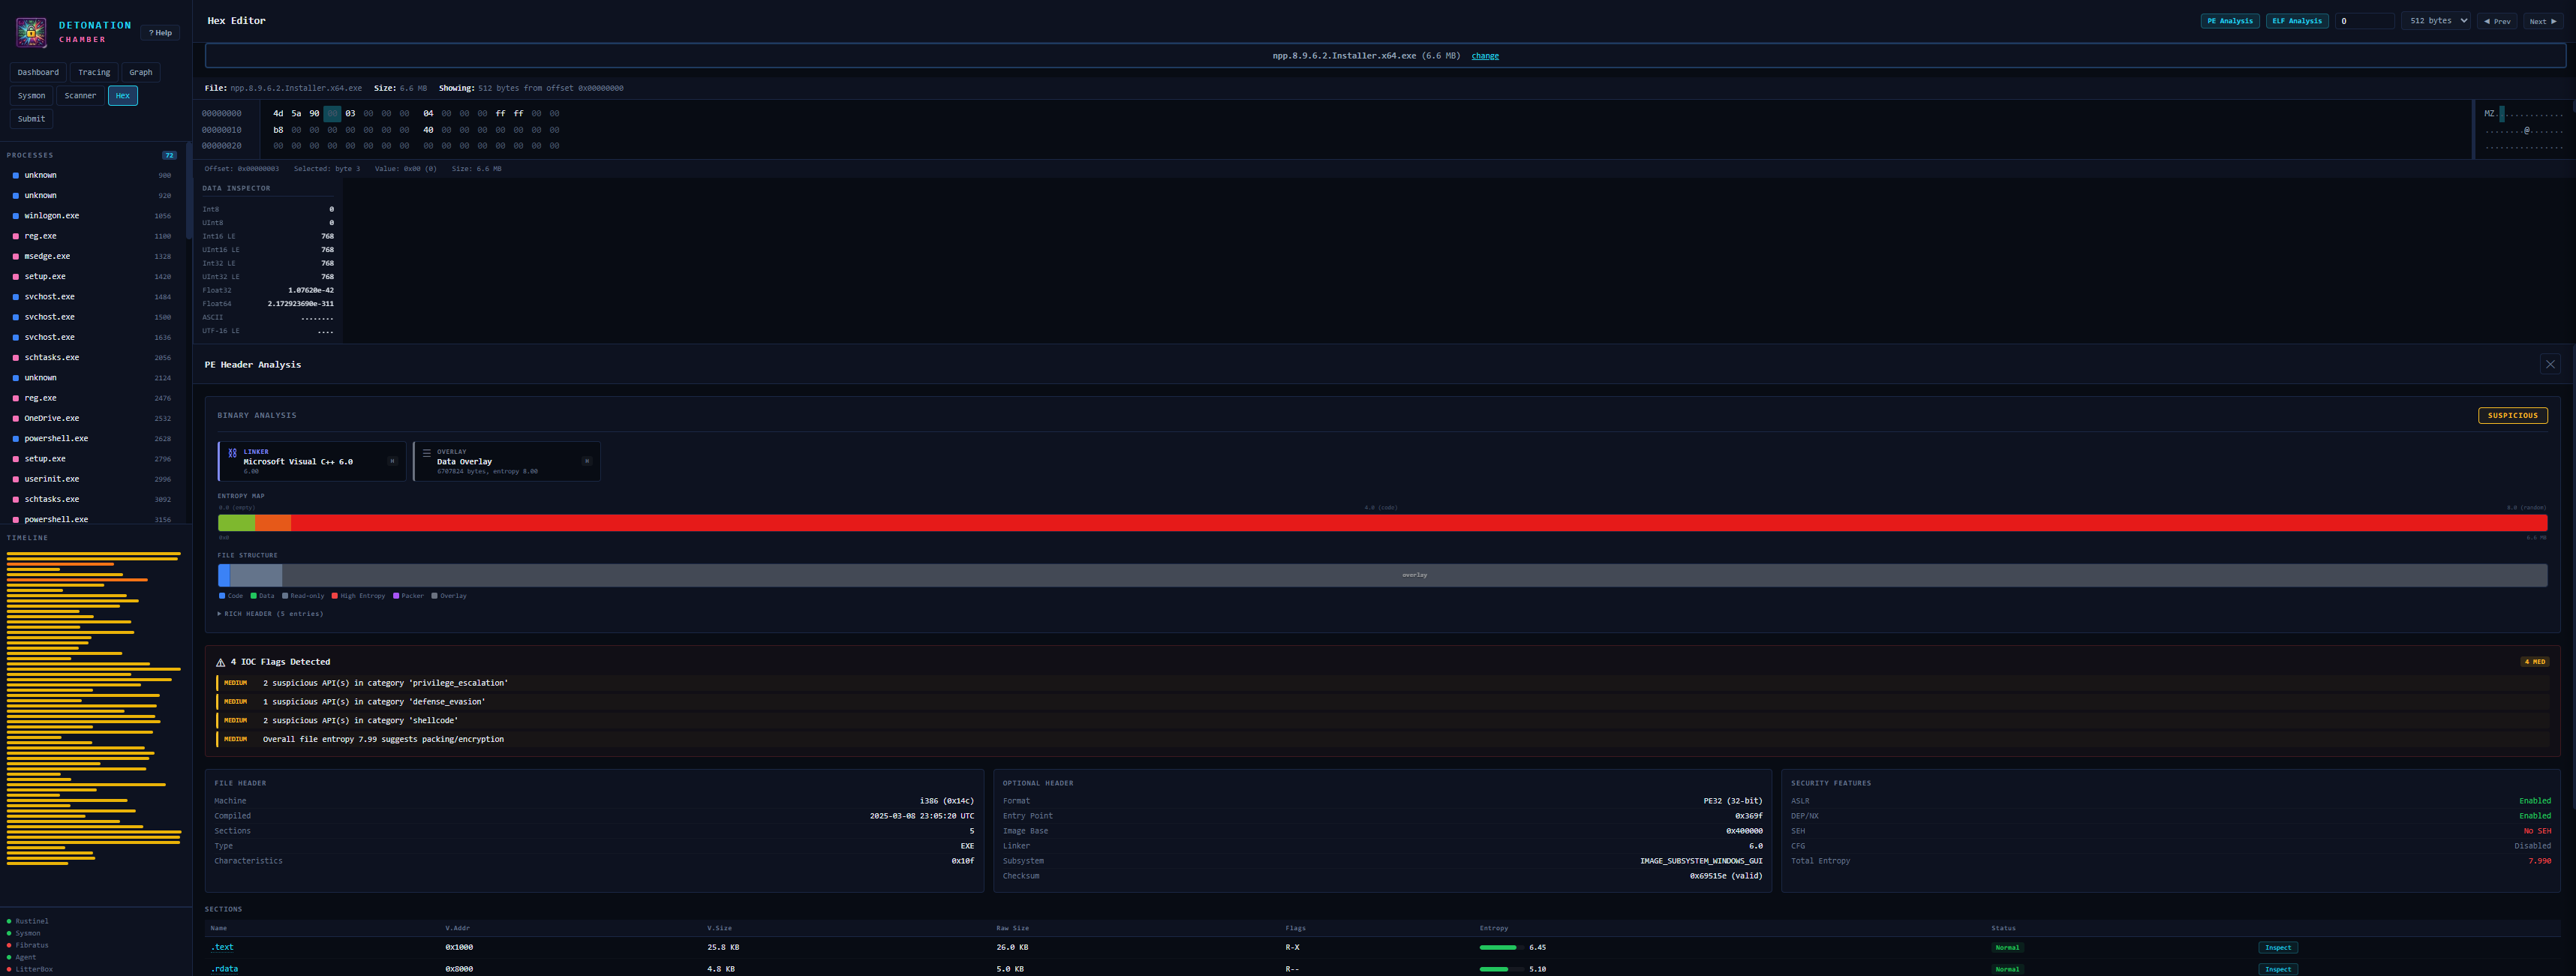
DiE-style detection overview with assessment badge (SUSPICIOUS/CLEAN). Detection cards identify compiler (“LINKER: Microsoft Visual C++ 6.0”), overlays, and protectors. An ENTROPY MAP color bar visualizes per-section entropy — green for low entropy sections (.text/.rdata), large red blocks for packed/compressed data (e.g. .ndata = NSIS compressed). FILE STRUCTURE shows a section layout diagram with legend (Code, Data, High Entropy, Overlay). Expandable sections include RICH HEADER entries.
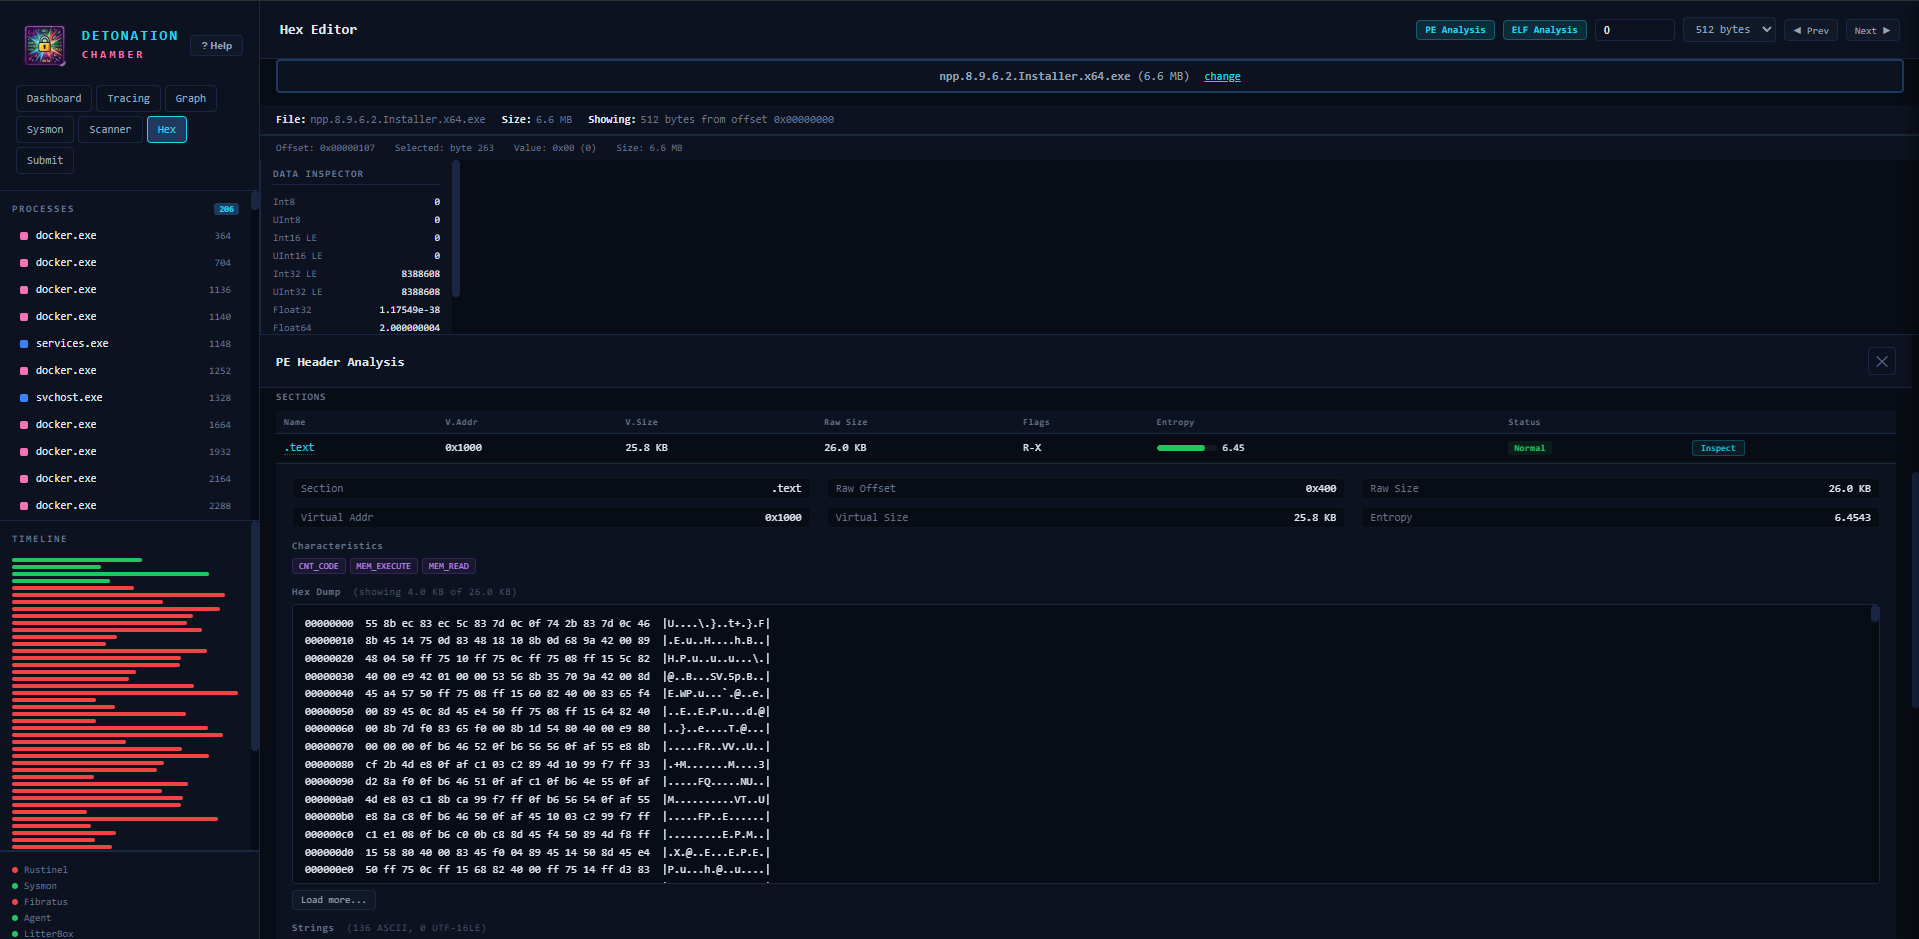
Section Inspection & Hex Editor
Section inspection expands in-line, showing metadata (Raw Offset, Raw Size, Virtual Address, Entropy) and characteristic badges (CNT_CODE, MEM_EXECUTE, MEM_READ). A live hex dump displays the first 4 KB with offsets, bytes, and ASCII representation, with “Load more…” for paging. Below the hex, extracted strings are listed (ASCII and UTF-16LE).
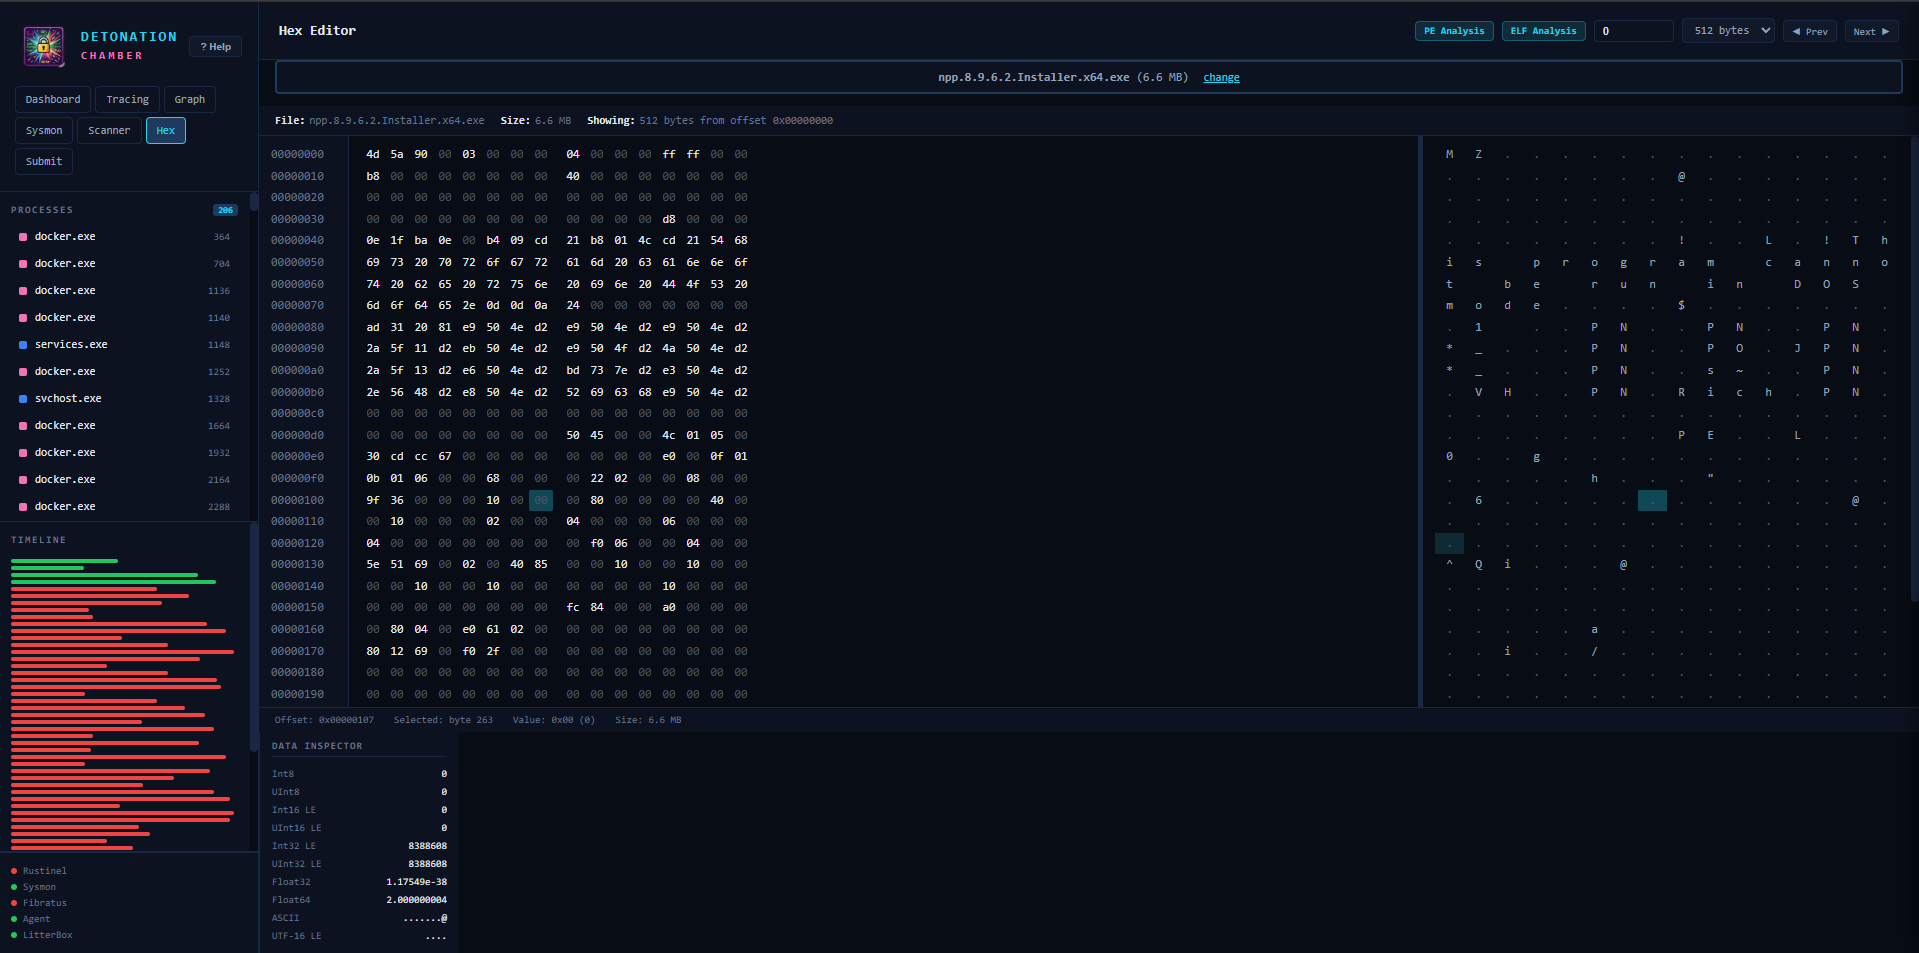
Raw hex editor showing 512-byte pages with offset navigation. The MZ header (4D 5A 90…) and DOS stub are visible with ASCII interpretation in the right column. The Data Inspector panel decodes the cursor position as Int8/16/32/64, Float32/64, ASCII, and UTF-16 LE. Quick-access buttons for PE/ELF Analysis sit in the toolbar alongside offset input and page navigation (Prev/Next).
Sysmon Event Monitoring
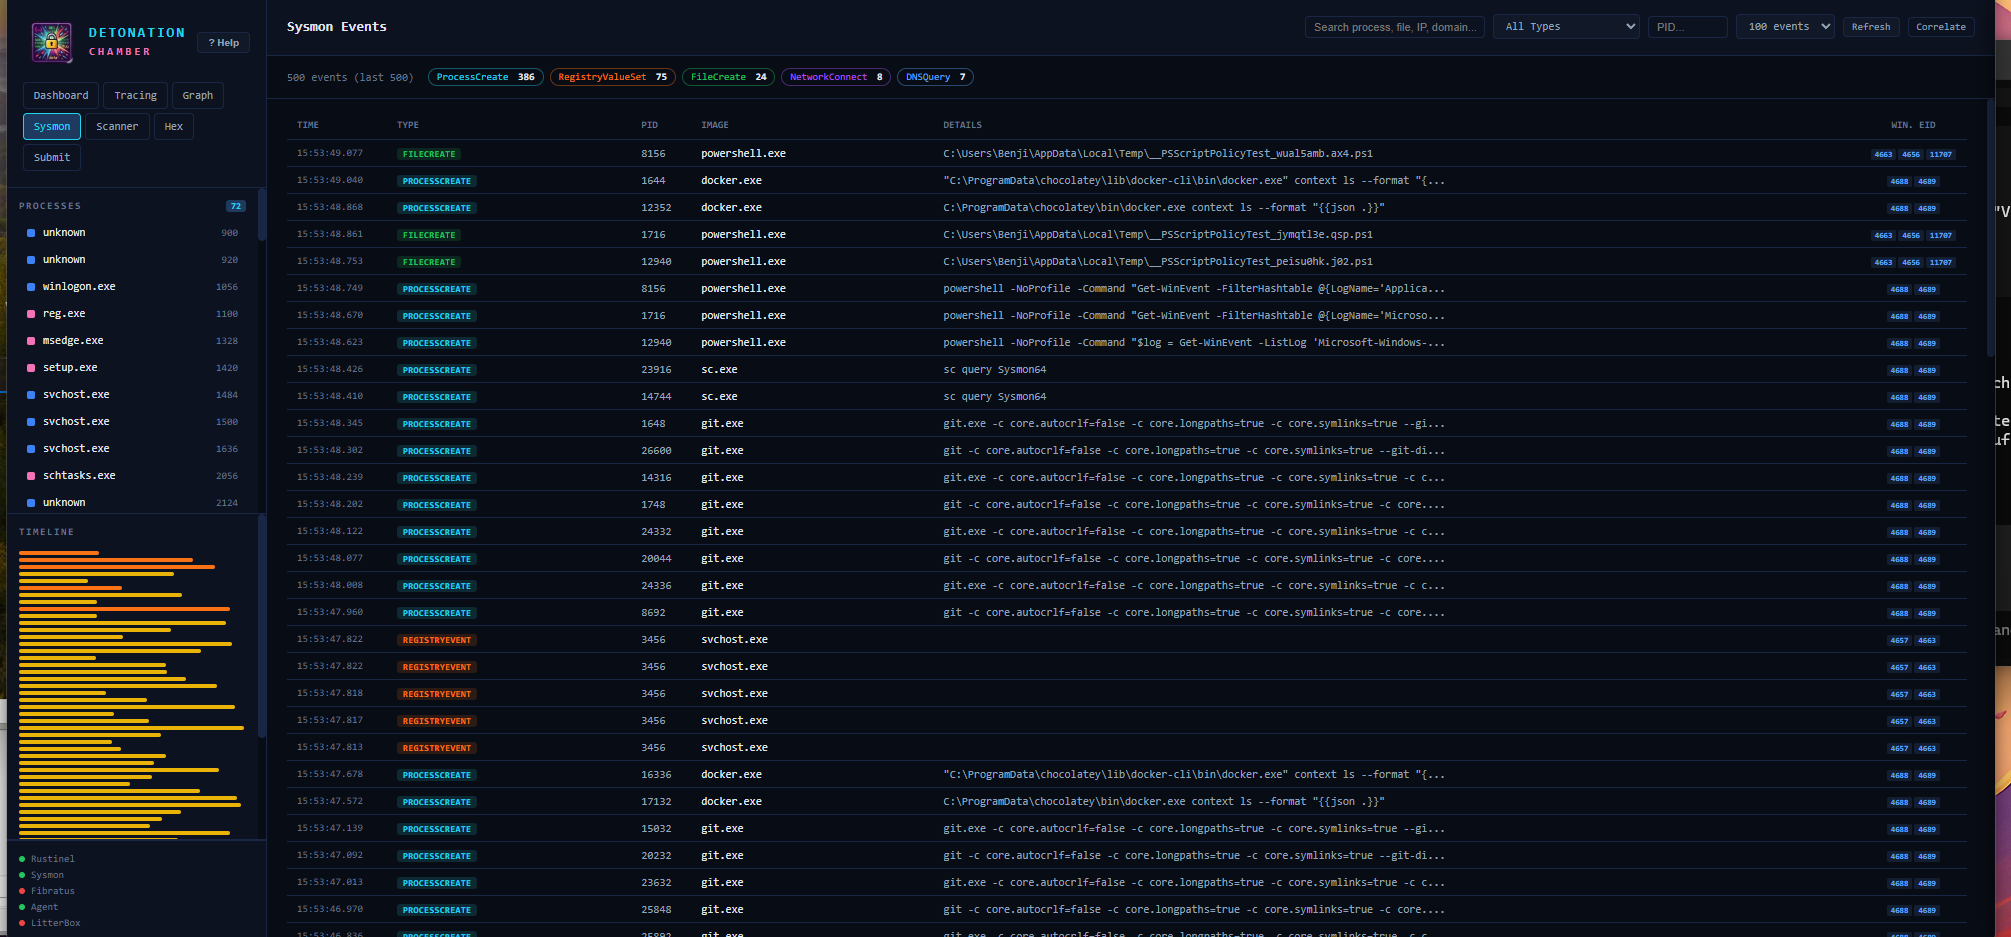
The Sysmon tab displays captured events with filter pills by type: ProcessCreate, RegistryValueSet, FileCreate, NetworkConnect, DNSQuery. The table shows TIME, TYPE (color-coded), PID, IMAGE, DETAILS (full command lines), and Windows Event ID column (4688, 4689, 4663, 4656, 11707). Search, type/PID dropdowns, max events slider, and Refresh/Correlate buttons allow targeted investigation.
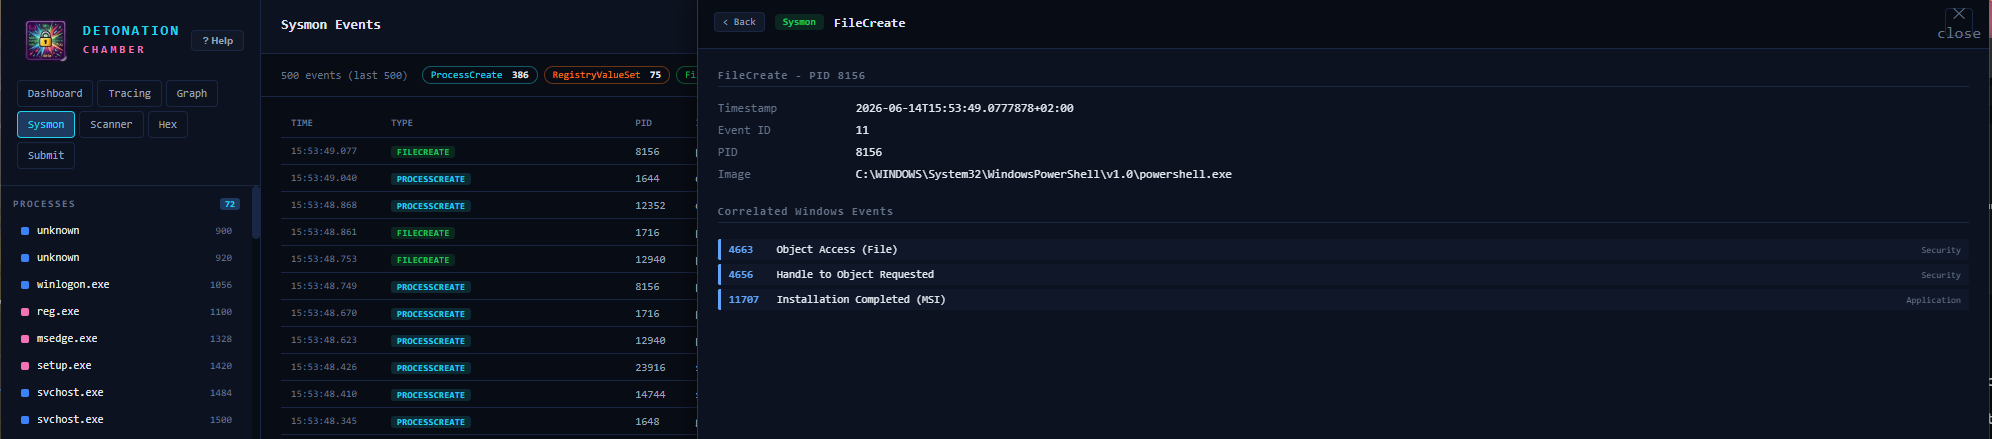
The detail panel for a FileCreate event shows timestamp, Sysmon Event ID, and originating image. “Correlated Windows Events” maps to related Security and Application log entries: 4663 “Object Access (File)”, 4656 “Handle to Object Requested”, and 11707 “Installation Completed (MSI)” — providing cross-log context for the same operation.
API Reference
All endpoints are served on port 9000 and return JSON.
Core Endpoints
| Method | Endpoint | Description |
|---|---|---|
| GET | /api/alerts |
All detection alerts (Rustinel + Fibratus + LitterBox) |
| GET | /api/processes |
Tracked processes with activity counts |
| GET | /api/status |
Service health status (all components) |
| GET | /api/rustinel |
Rustinel engine info (rules, version) |
| GET | /api/submissions |
Submission history (last 200) |
Submission & Detonation
| Method | Endpoint | Description |
|---|---|---|
| POST | /api/submit |
Submit sample (multipart). Params: file, target (agent/litterbox/both) |
| GET | /api/detonation/results |
Poll results. Params: sha256, pid, litterbox_hash, filename |
Hex Editor & Binary Analysis
| Method | Endpoint | Description |
|---|---|---|
| GET | /api/file/hex |
Hex dump. Params: path, offset, bytes |
| POST | /api/file/hex/upload |
Upload file for hex viewing |
| GET | /api/file/pe |
PE header analysis. Param: path |
| GET | /api/file/elf |
ELF binary analysis. Param: path |
Sysmon & Scanner
| Method | Endpoint | Description |
|---|---|---|
| GET | /api/sysmon |
Sysmon events. Params: max, event_id, pid |
| GET | /api/sysmon/stats |
Sysmon statistics and diagnostics |
| POST | /api/scan/threatcheck |
ThreatCheck scan. Params: file/path, engine, type |
| POST | /api/scan/defendercheck |
DefenderCheck scan. Params: file/path |
| GET | /api/scan/status |
Scanner tool availability |
Proxy Endpoints
| Method | Endpoint | Description |
|---|---|---|
| GET/POST | /api/litterbox/<path> |
Proxy to LitterBox API (:1337) |
| GET | /api/fibratus/<path> |
Proxy to Fibratus API (:8180) |
Configuration
Environment Variables
| Variable | Default | Description |
|---|---|---|
RUSTINEL_ALERTS_DIR |
C:\tools\rustinel\logs |
Rustinel NDJSON alert directory |
RUSTINEL_INSTALL_DIR |
C:\tools\rustinel |
Rustinel installation root |
DETONATOR_API |
http://127.0.0.1:8000 |
Detonator REST API |
DETONATOR_AGENT_API |
http://127.0.0.1:8080 |
DetonatorAgent API |
LITTERBOX_API |
http://127.0.0.1:1337 |
LitterBox API |
WEBUI_PORT |
9000 |
Web UI listen port |
Custom Detection Rules
Detection rules support hot-reload — changes take effect without restarting services:
- Sigma rules:
C:\tools\detection-rules\rustinel-rules\dist\windows-advanced\rules\sigma\ - YARA rules:
C:\tools\detection-rules\yara-combined\ - IOC hashes:
C:\tools\detection-rules\rustinel-rules\dist\windows-advanced\rules\ioc\(SHA-256, one per line)
Links
◀ Back to the Blog