
![]() As described in my Blog post for defenders: Windows ETW (Event Tracing for Windows) - ETW is a crucial system component for EDR/XDR to identify malicious behavior on Windows. Since the post is going into the depth, I recommend to read this post first before you go down the rabbit hole in this post.
As described in my Blog post for defenders: Windows ETW (Event Tracing for Windows) - ETW is a crucial system component for EDR/XDR to identify malicious behavior on Windows. Since the post is going into the depth, I recommend to read this post first before you go down the rabbit hole in this post.
| Related posts in this blog: Understanding and Attacking EDRs | Detecting EDR Hooks | ETW-TI Deep Dive | EDR Bypass Roadmap |
Important caveat: The techniques in this article target user-mode ETW providers (e.g., patching
ntdll!EtwEventWrite, killing tracing sessions vialogman). These do NOT affect the kernel-mode ETW Threat Intelligence (ETW-TI) provider, which fires events directly fromntoskrnl.exekernel callbacks and requires PPL-level access to consume or tamper with. For a deep dive into ETW-TI architecture, its kernel sensors, and the actual bypass vectors that work against it, see the ETW-TI Deep Dive.
- Useful links
- Main targets for an attacker
- Short summary about the Terminology
- Logman.exe - Create a Tracing Session
- Add Microsoft-Windows-Kernel-Process to spotless-tracing session
Useful links
A great source to understand what’s going on with ETW and EDR on a Red Teamer perspective:
- Build your own EDR - Pastebin
- Benji’s ProcMon
- EDRSilencer
- EDRSilencer: uses WFP to block EDR agents from reporting security events to the server
- BestEdrOfTheMarket
- SylantStrike
- OpenEDR
- Tampering with Windows Event Tracing: Background, Offense, and Defense
- EDRHunt
Main targets for an attacker
Considering the viewpoint of an adversary, when faced with an EDR (Endpoint Detection and Response) or logging capability, there exists the potential to thwart system monitoring by terminating their tracing session or eliminating specific providers from said session.
From the standpoint of a defender, strategic actions may include:
- Expanding knowledge about the supplementary telemetry accessible through ETW.
- Formulating detection strategies aimed at identifying and preventing attackers trying to manipulate telemetry via ETW.
Short summary about the Terminology
You find a detailed discussion in the defender blog post mentioned in the intro. To have all details on one page here is a short summary:
- Event Tracing for Windows (ETW) is a Windows OS logging mechanism for troubleshooting and diagnostics, that allows us to tap into an enormous number of events that are generated by the OS every second
- Providers are applications that can generate some event logs
- Keywords are event types the provider is able to serve the consumers with
- Consumers are applications that subscribe and listen to events emitted by providers
- Tracing session records events from one or more providers Controllers are applications that can start a trace session and enable or disable providers in that trace .
Logman.exe
Logman.exe is a native Windows command-line utility, which is considered to be a Controller. A good deep dive can be found here. Now let’s discuss the offensive side a little deeper:
Create a Tracing Session
Requires NO Administrator privileges
Let’s create a trace session called spotless-tracing
logman create trace spotless-tracing -ets
This command should look like this after creation:

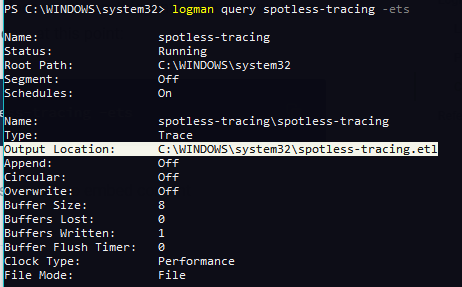
We can query the tracing session and see some information about it:
logman query spotless-tracing -ets
Note that at the moment, although the tracing session is running, it is not recording any events as we have not yet subscribed to any providers:
Add Microsoft-Windows-Kernel-Process to spotless-tracing session
Within the spotless-tracing session, we’ll subscribe to events related to PROCESSES and IMAGES provided by the Microsoft-Windows-Kernel-Process provider to observe their characteristics.
To subscribe to these events, we must reference the available keywords of Microsoft-Windows-Kernel-Process and combine 0x10 (WINEVENT_KEYWORD_PROCESS) with 0x40 (WINEVENT_KEYWORD_IMAGE), resulting in a total of 0x50:
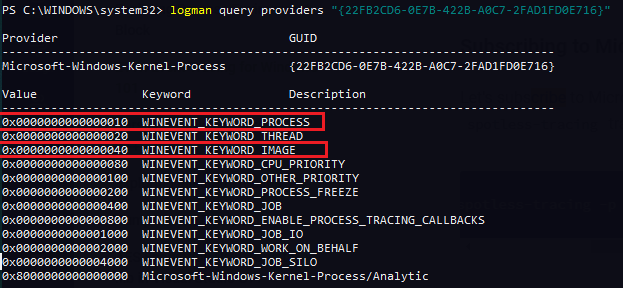
We can now register a provider to the tracing session and ask it to emit events that map back to events WINEVENT_KEYWORD_PROCESS and WINEVENT_KEYWORD_IMAGE:
logman update spotless-tracing -p Microsoft-Windows-Kernel-Process 0x50 -ets
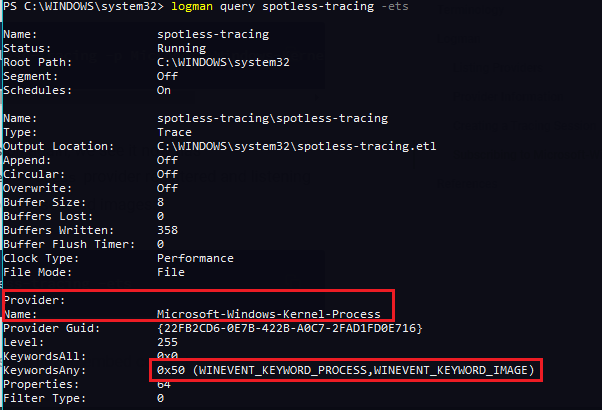
If we query the tracing session again, we see it now has Microsoft-Windows-Kernel-Processprovider registered and listening to the two event types pertaining to processes (start/exit) and images (load/unload):
logman query spotless-tracing -ets
Checking the .etl Log
After the tracing session has run for some time, we can check the log file by opening it with the Windows Event Viewer. We can see process creation events (event ID 1):

Image load events (event ID 5):
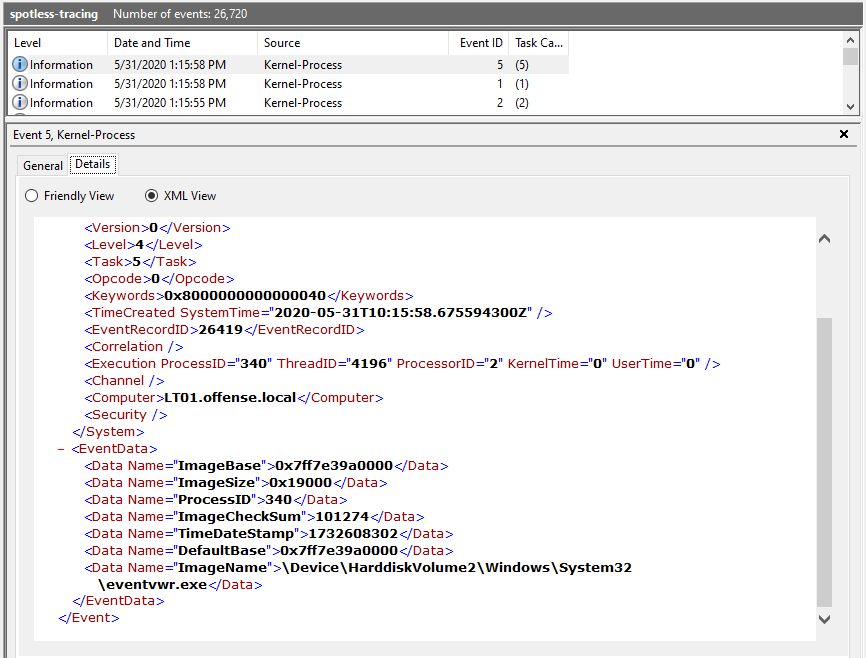
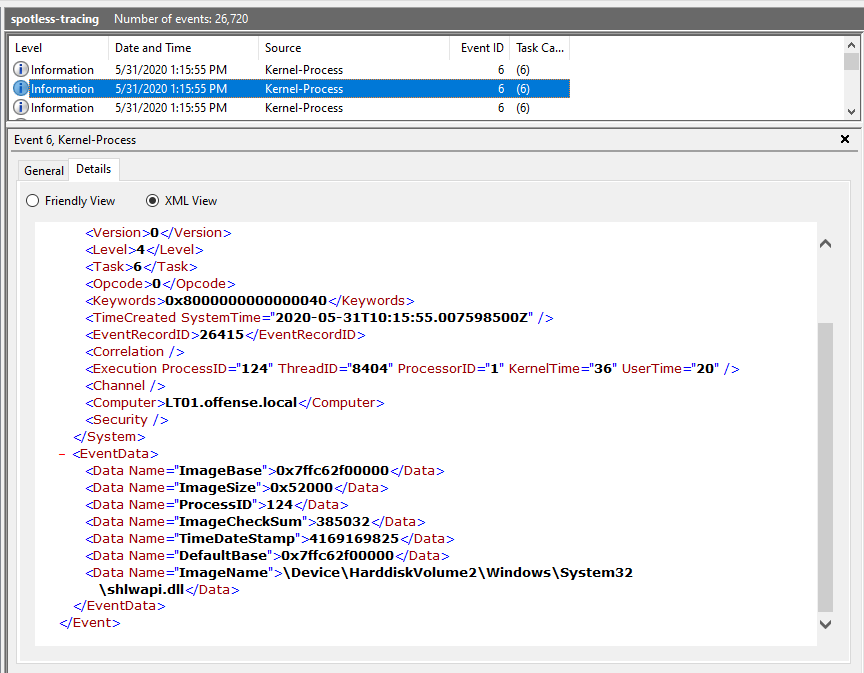
Image unload events (event ID 6):
Removing Providers from a Tracing Session
Providers can be removed like this:
logman update trace spotless-tracing --p Microsoft-Windows-Kernel-Process 0x50 -ets
Using this command will result in a no longer association of the kernel provider with the spotless-tracing session
Killing Tracing Sessions
The overall session can also be killed like this:
logman stop spotless-tracing -ets
This command can also be handy if you identify running sessions from EDR/XDR tools.
Consuming Events via C#
# code by Pavel Yosifovich, https://github.com/zodiacon/DotNextSP2019/blob/master/SimpleKernelConsumer/Program.cs
using Microsoft.Diagnostics.Tracing;
using Microsoft.Diagnostics.Tracing.Parsers;
using Microsoft.Diagnostics.Tracing.Session;
using System;
using System.Collections.Generic;
using System.Diagnostics;
using System.Linq;
using System.Text;
using System.Threading;
using System.Threading.Tasks;

namespace SimpleKernelConsumer {
	class ProcessInfo {
		public int Id { get; set; }
		public string Name { get; set; }
	}

	class Program {
		static void Main(string[] args) {
			var processes = Process.GetProcesses().Select(p => new ProcessInfo {
				Name = p.ProcessName,
				Id = p.Id
			}).ToDictionary(p => p.Id);

			using (var session = new TraceEventSession(Environment.OSVersion.Version.Build >= 9200 ? "MyKernelSession" : KernelTraceEventParser.KernelSessionName)) {
				session.EnableKernelProvider(KernelTraceEventParser.Keywords.Process | KernelTraceEventParser.Keywords.ImageLoad);
				var parser = session.Source.Kernel;

				parser.ProcessStart += e => {
					Console.ForegroundColor = ConsoleColor.Green;
					Console.WriteLine($"{e.TimeStamp}.{e.TimeStamp.Millisecond:D3}: Process {e.ProcessID} ({e.ProcessName}) Created by {e.ParentID}: {e.CommandLine}");
					processes.Add(e.ProcessID, new ProcessInfo { Id = e.ProcessID, Name = e.ProcessName });
				};
				parser.ProcessStop += e => {
					Console.ForegroundColor = ConsoleColor.Red;
					Console.WriteLine($"{e.TimeStamp}.{e.TimeStamp.Millisecond:D3}: Process {e.ProcessID} {TryGetProcessName(e)} Exited");
				};

				parser.ImageLoad += e => {
					Console.ForegroundColor = ConsoleColor.Yellow;
					var name = TryGetProcessName(e);
					Console.WriteLine($"{e.TimeStamp}.{e.TimeStamp.Millisecond:D3}: Image Loaded: {e.FileName} into process {e.ProcessID} ({name}) Size=0x{e.ImageSize:X}");
				};

				parser.ImageUnload += e => {
					Console.ForegroundColor = ConsoleColor.DarkYellow;
					var name = TryGetProcessName(e);
					Console.WriteLine($"{e.TimeStamp}.{e.TimeStamp.Millisecond:D3}: Image Unloaded: {e.FileName} from process {e.ProcessID} ({name})");
				};

				Task.Run(() => session.Source.Process());
				Thread.Sleep(TimeSpan.FromSeconds(60));
			}

			string TryGetProcessName(TraceEvent evt) {
				if (!string.IsNullOrEmpty(evt.ProcessName))
					return evt.ProcessName;
				return processes.TryGetValue(evt.ProcessID, out var info) ? info.Name : string.Empty;
			}
		}
	}
}